

INTRODUCTION
Tobacco use and exposure to secondhand tobacco smoke (SHS) are well-established carcinogenic factors and represent major public health concerns. Tobacco consumption remains the single largest preventable health risk and the leading cause of premature mortality in the European Union (EU), accounting for nearly 700000 deaths annually1. Observational studies conducted in several Asian countries among both adult and pediatric populations have reported a significant association between tobacco exposure and the development of allergic rhinitis (AR)2,3. Furthermore, a large population-based study in China demonstrated that children exposed to passive smoking have an increased risk of developing AR and asthma4.
Accumulating epidemiological evidence has consistently shown that tobacco exposure adversely affects blood pressure regulation and cardiovascular prognosis, establishing it as an important modifiable risk factor for cardiovascular disease5. Moreover, worsening smoking behaviors have been associated with an increased risk of cardiovascular events and all-cause mortality6. A cross-cohort collaborative study involving 182364 participants reported that smoking-induced subclinical vascular damage, including elevated blood pressure and increased arterial stiffness, can be partially reversed within five years after smoking cessation; however, these measures do not fully return to the physiological levels observed in never smokers7.
Although the pathophysiology of hypertension is multifactorial and not yet fully elucidated, emerging evidence suggests a complex interplay between hypertension and AR8. However, the temporal divergence in the onset of AR and CVD may complicate this association9. AR prevalence typically peaks during the second to fourth decades of life and subsequently declines, whereas the incidence of CVD increases with advancing age10 . This temporal mismatch raises the question of whether lower systolic blood pressure (SBP) could be a risk factor for AR. Contrary to this hypothesis, Kony et al.11 reported that, after adjusting for confounding variables including age, body mass index (BMI), hypercholesterolemia, and smoking status, men with AR exhibited significantly higher SBP compared to their non-AR counterparts (130 ± 12.7 vs 123.5 ± 13.9 mmHg; p=0.002), suggesting that AR may serve as an independent risk factor for elevated SBP in males11. Conversely, a 2018 study by Sakallioglu et al.12 found no significant differences in systolic or diastolic blood pressure among patients with seasonal or perennial AR. Their analysis concluded that there was no statistically significant association between AR and blood pressure elevation12.
Establishing a relationship between low SBP and AR poses significant challenges in observational studies due to inherent methodological limitations, including the absence of randomization, potential confounding factors, and the risk of reverse causality. Although randomized controlled trials (RCTs) are considered the gold standard for causal inference, ethical and logistical constraints often limit their feasibility in this context. Mendelian randomization (MR) has emerged as a robust alternative approach, leveraging genetic variants as instrumental variables to infer associations between exposures and outcomes. These genetic variants, which are randomly allocated at conception in accordance with Mendel’s laws, provide a natural experiment that minimizes confounding and mitigates reverse causality13. The rapid advancement of genome-wide association studies (GWAS) and meta-analyses of GWAS data has further enhanced the validity and applicability of MR as a powerful tool for causal inference in epidemiology14.
Two-sample MR, which utilizes summary-level statistics from independent GWAS datasets, enables the estimation of the effects by linking genetic variants associated with an exposure in one sample to those associated with an outcome in a separate, but comparable, sample. This design improves statistical power and generalizability while preserving the foundational assumptions of MR. Recent MR studies investigating the association between AR and hypertension have suggested a potential protective effect of AR against the development of hypertension in European populations15. Specifically, these findings indicate that AR may be linked to a reduced risk of hypertension. However, previous analyses were limited by the small number of single-nucleotide polymorphisms (SNPs) used as instrumental variables and the reliance on outdated genetic datasets, which may compromise the robustness and generalizability of the results. In the present study, we sought to address the aforementioned gap by performing a bidirectional two-sample Mendelian randomization (MR) analysis to elucidate the relationship between systolic blood pressure (SBP) and allergic rhinitis (AR), with active or passive smoking incorporated as a key moderating variable. We utilized the most up-to-date GWAS summary statistics for SBP (ieu-b-38), AR (ebi-a-GCST90038664), and current tobacco smoking (ukb-b-223). By integrating smoking-related genetic instruments into our analysis, we aimed to determine whether the association between SBP and AR is independent of active or passive smoking, or whether smoking mediates or modifies this relationship.
METHODS
Data source
This study was conducted in strict accordance with the core design principles and analytical framework of MR, as outlined in Figure 1. Summary-level GWAS data for SBP were obtained from the International Consortium of Blood Pressure (ieu-b-38), published in 2018 and accessible via the IEU Open GWAS Project16. This dataset comprises 757601 individuals and includes 7088083 SNPs (Figure 2A).
Figure 1
Diagram of the MR models assessing if low systolic blood pressure increases the risk of allergic rhinitis, accounting for smoking
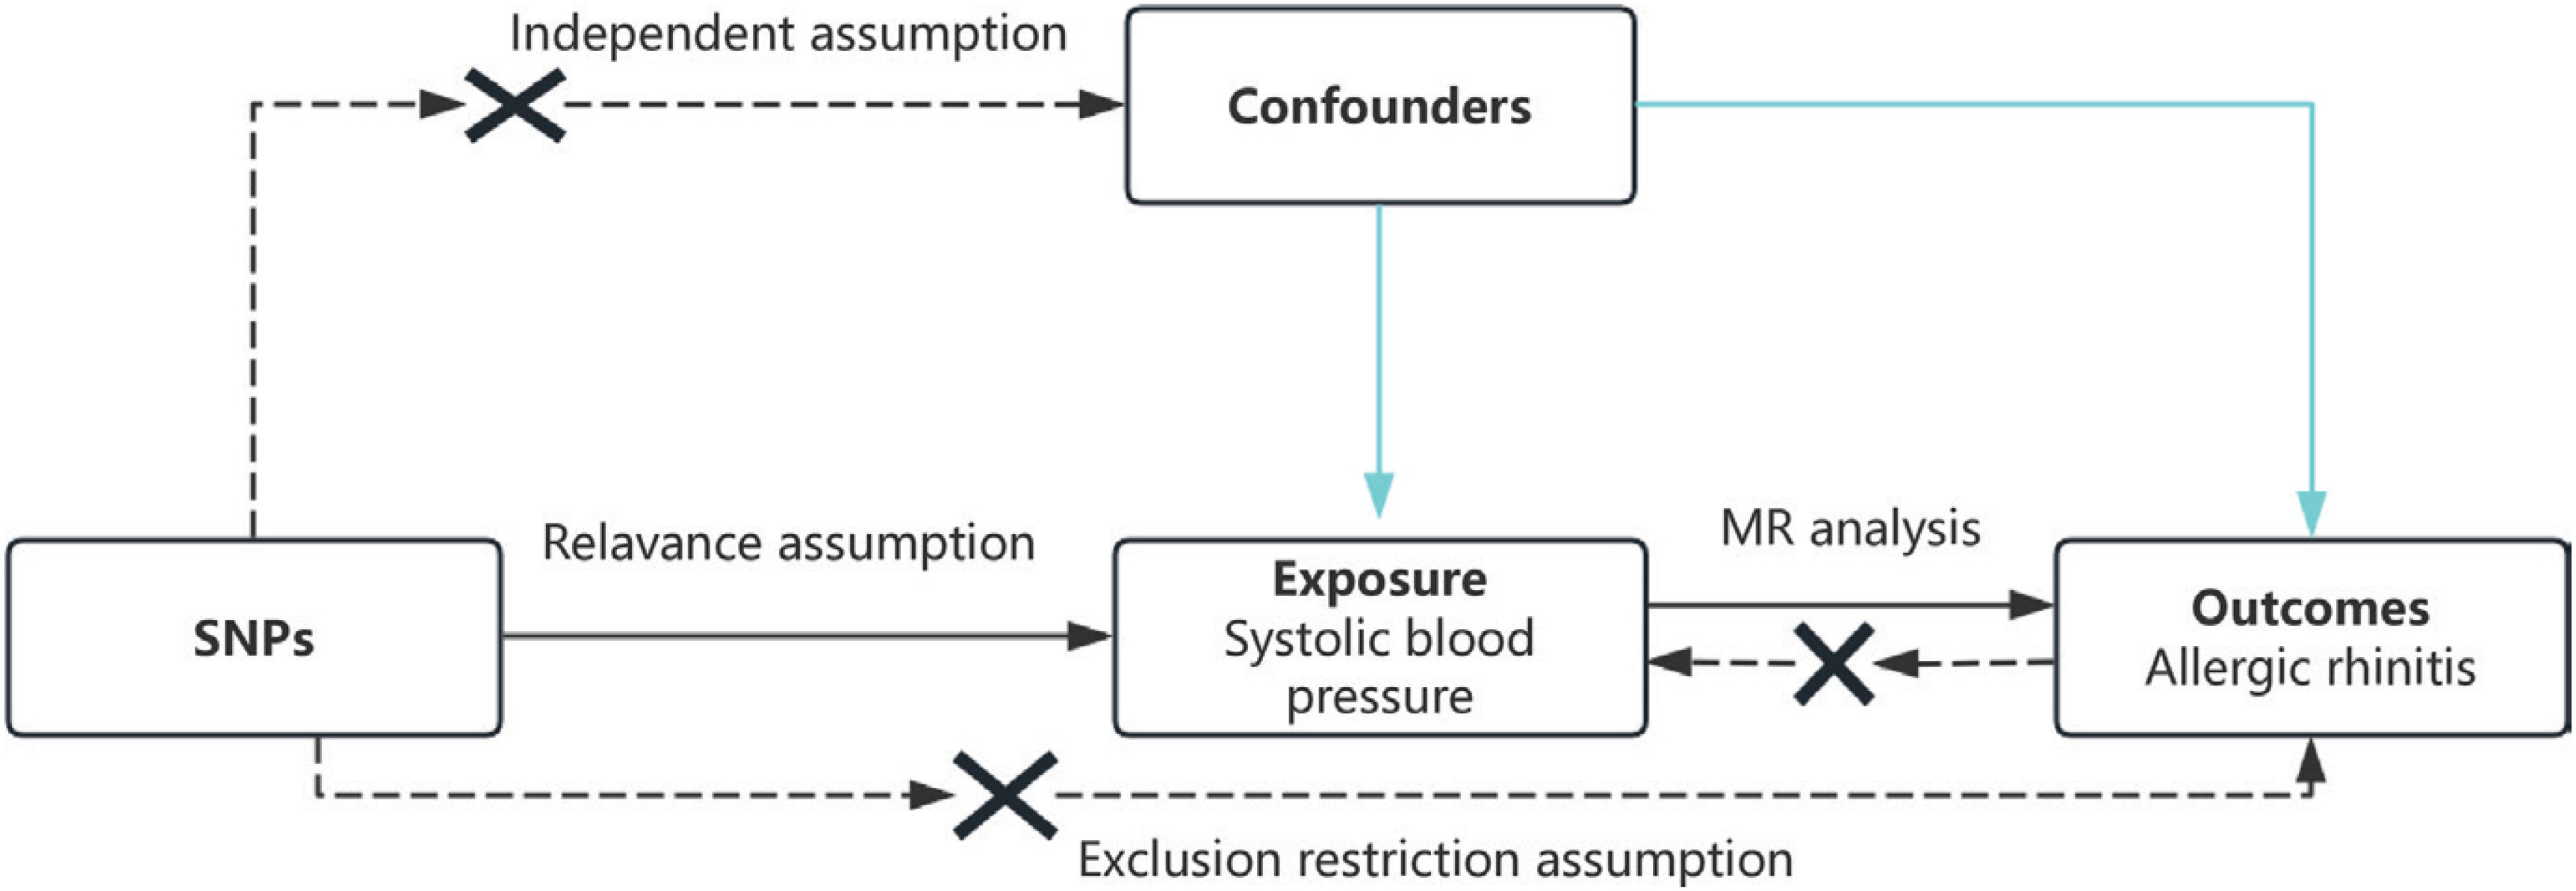
Figure 2
Manhattan plot of the included single nucleotide polymorphisms: A) SBP, data from IEU OpenGWAS in 2018 (SNPs=7088083; red line as threshold; p=5×10⁻⁸); B) AR data from IEU OpenGWAS in 2021 (SNPs=9587836; red line as threshold; p=5×10⁻⁸)
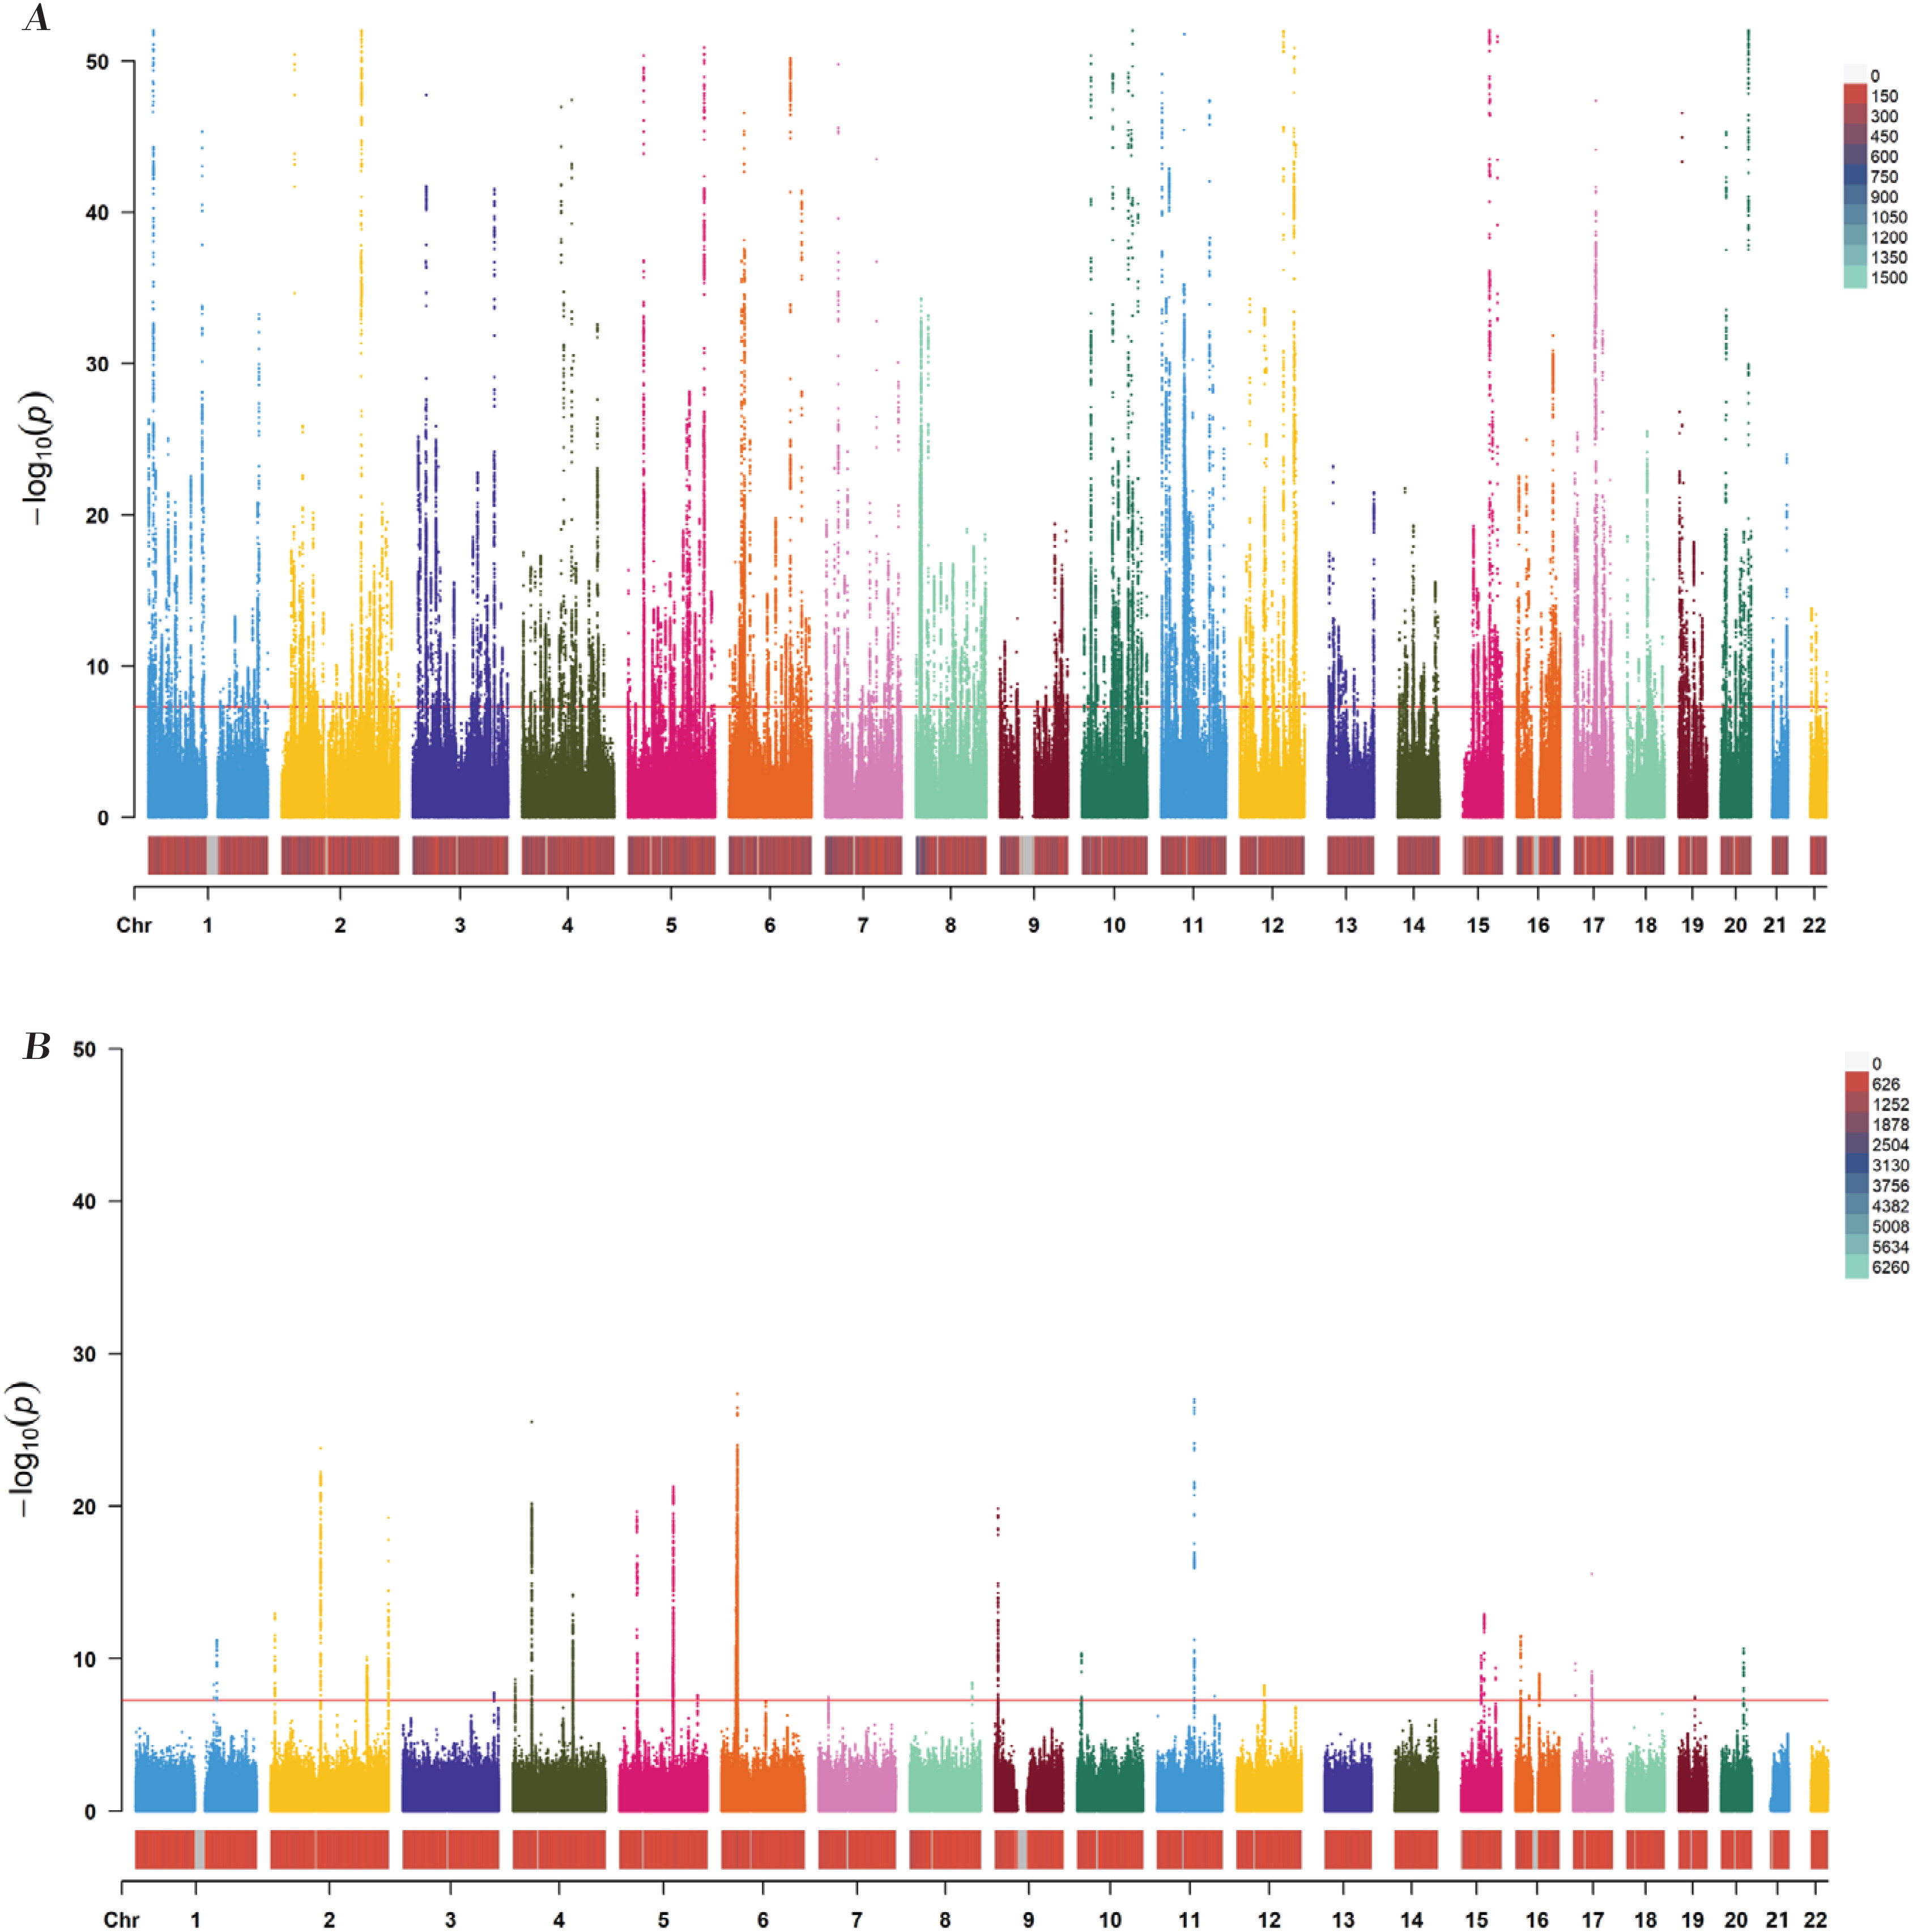
The GWAS summary data for AR were sourced from the EMBL-EBI database (study ID: ebi-a-GCST90038664), based on a European cohort published in 202117. This dataset includes 484598 participants and 9587836 SNPs (Figure 2B). Detailed characteristics of the included studies and datasets are summarized in Table 1. The smoking dataset was obtained from the UK Biobank18 and included 462434 participants and 9851867 SNPs. The data were published in 2018.
Table 1
Details of studies and datasets used in the study, data from 2018 and 2021 (N=757601 for systolic blood pressure; N=484598 for allergic rhinitis; N=462434 for current tobacco smoking)
| Exposure/outcomes | Web source | Sample size | SNP size | Authors | Consortium | Year | Population studied |
|---|---|---|---|---|---|---|---|
| Systolic blood pressure | IEU Open GWAS project (ieu-b-38) | 757601 | 7088083 | Evangelou et al.16 | International Consortium of Blood Pressure | 2018 | European |
| Allergic rhinitis | EMBL-EBI (ebi-a-GCST90038664) | 484598 | 9587836 | NA | NA | 2021 | European |
| Current tobacco smoking | UK Biobank (ukb-b-223) | 462434 | 9851867 | Hemani et al.20 | MRC-IEU | 2018 | European |
All MR analyses were conducted in accordance with the STROBE-MR reporting guidelines to ensure methodological rigor and transparency (Supplementary file Table 1)19.
Selection of instrumental variables
Instrumental variables (IVs) were rigorously selected based on strict inclusion criteria to ensure the validity of the MR analysis. SNPs were required to: 1) reach genome-wide significance (p<5×10⁻⁸) for association with the exposure; and 2) exhibit a minor allele frequency (MAF) greater than 0.01 in the outcome dataset. To minimize linkage disequilibrium (LD), SNPs with pairwise r2 >0.001 within a 10000 kb window were excluded. Additionally, SNPs identified as associated with potential confounders or outcomes via the FastTraitR package were excluded to mitigate horizontal pleiotropy. Specifically, variants such as rs6771917, rs2643826, rs3918226, rs3735533, rs12978472, rs12258967, rs57866767, rs6271, rs6031431, rs17608766, rs7463212, rs12509595, rs35443, rs2024385, rs7134677, rs7338758, rs12906962, rs77924615, rs35783704, rs8118848 – implicated in medication use (calcium channel blockers) – were manually removed from the analysis, several SNPs (rs2014408, rs17080102, rs3918226, rs17249754, rs17010957, rs13107325, rs3918226) were excluded due to their known associations with tobacco use. After applying these filters, a total of 421 independent SNPs were retained for downstream analysis.
The proportion of variance explained by each SNP was calculated using the formula:
where β is the effect size, EAF is the effect allele frequency, SE is the standard error, and N is the sample size. Instrument strength was evaluated using the F-statistic:
where k denotes the number of IVs, an F-statistic <10 was considered indicative of weak instruments, which may bias the estimates20.
Main analysis
Following the extraction of summary-level GWAS data for SBP and AR via the MR-Base platform, a two-sample MR analysis was performed using the TwoSampleMR package (v0.6.14) in R (v4.3.2). Three complementary MR methods were applied to estimate the effects: inverse variance weighted (IVW), weighted median, and MR-Egger regression20-23. The IVW method, which assumes all instruments are valid, combines the SNP-specific Wald ratios using a meta-analytic approach20,21. The weighted median approach provides consistent estimates when at least 50% of the weight comes from valid instruments. MR-Egger regression, which accounts for directional pleiotropy, produces unbiased estimates even if some instruments are invalid, provided the InSIDE assumption is met23. The slope of the MR-Egger regression represents the estimate, while the intercept term tests for the presence of unbalanced horizontal pleiotropy. Results are reported as odds ratio (OR) with corresponding 95% confidence interval (CI), and a p<0.05 was considered statistically significant.
Sensitivity analysis
To assess the robustness of the findings, leave-one-out analysis was conducted. Each SNP was sequentially removed, and the estimate was recalculated using the IVW method to evaluate the influence of individual SNPs on the overall results. This approach ensures that the observed associations are not disproportionately driven by any single instrumental variable24.
RESULTS
Characteristics of included SNPs
Comprehensive information on the instrumental variables used in this study is provided in Supplementary file Table 2. This includes the effect allele (EA), effect allele frequency (EAF), and detailed association estimates with both SBP and AR, including β coefficients, standard errors (SE), and corresponding p-values.
The effect of SBP on AR
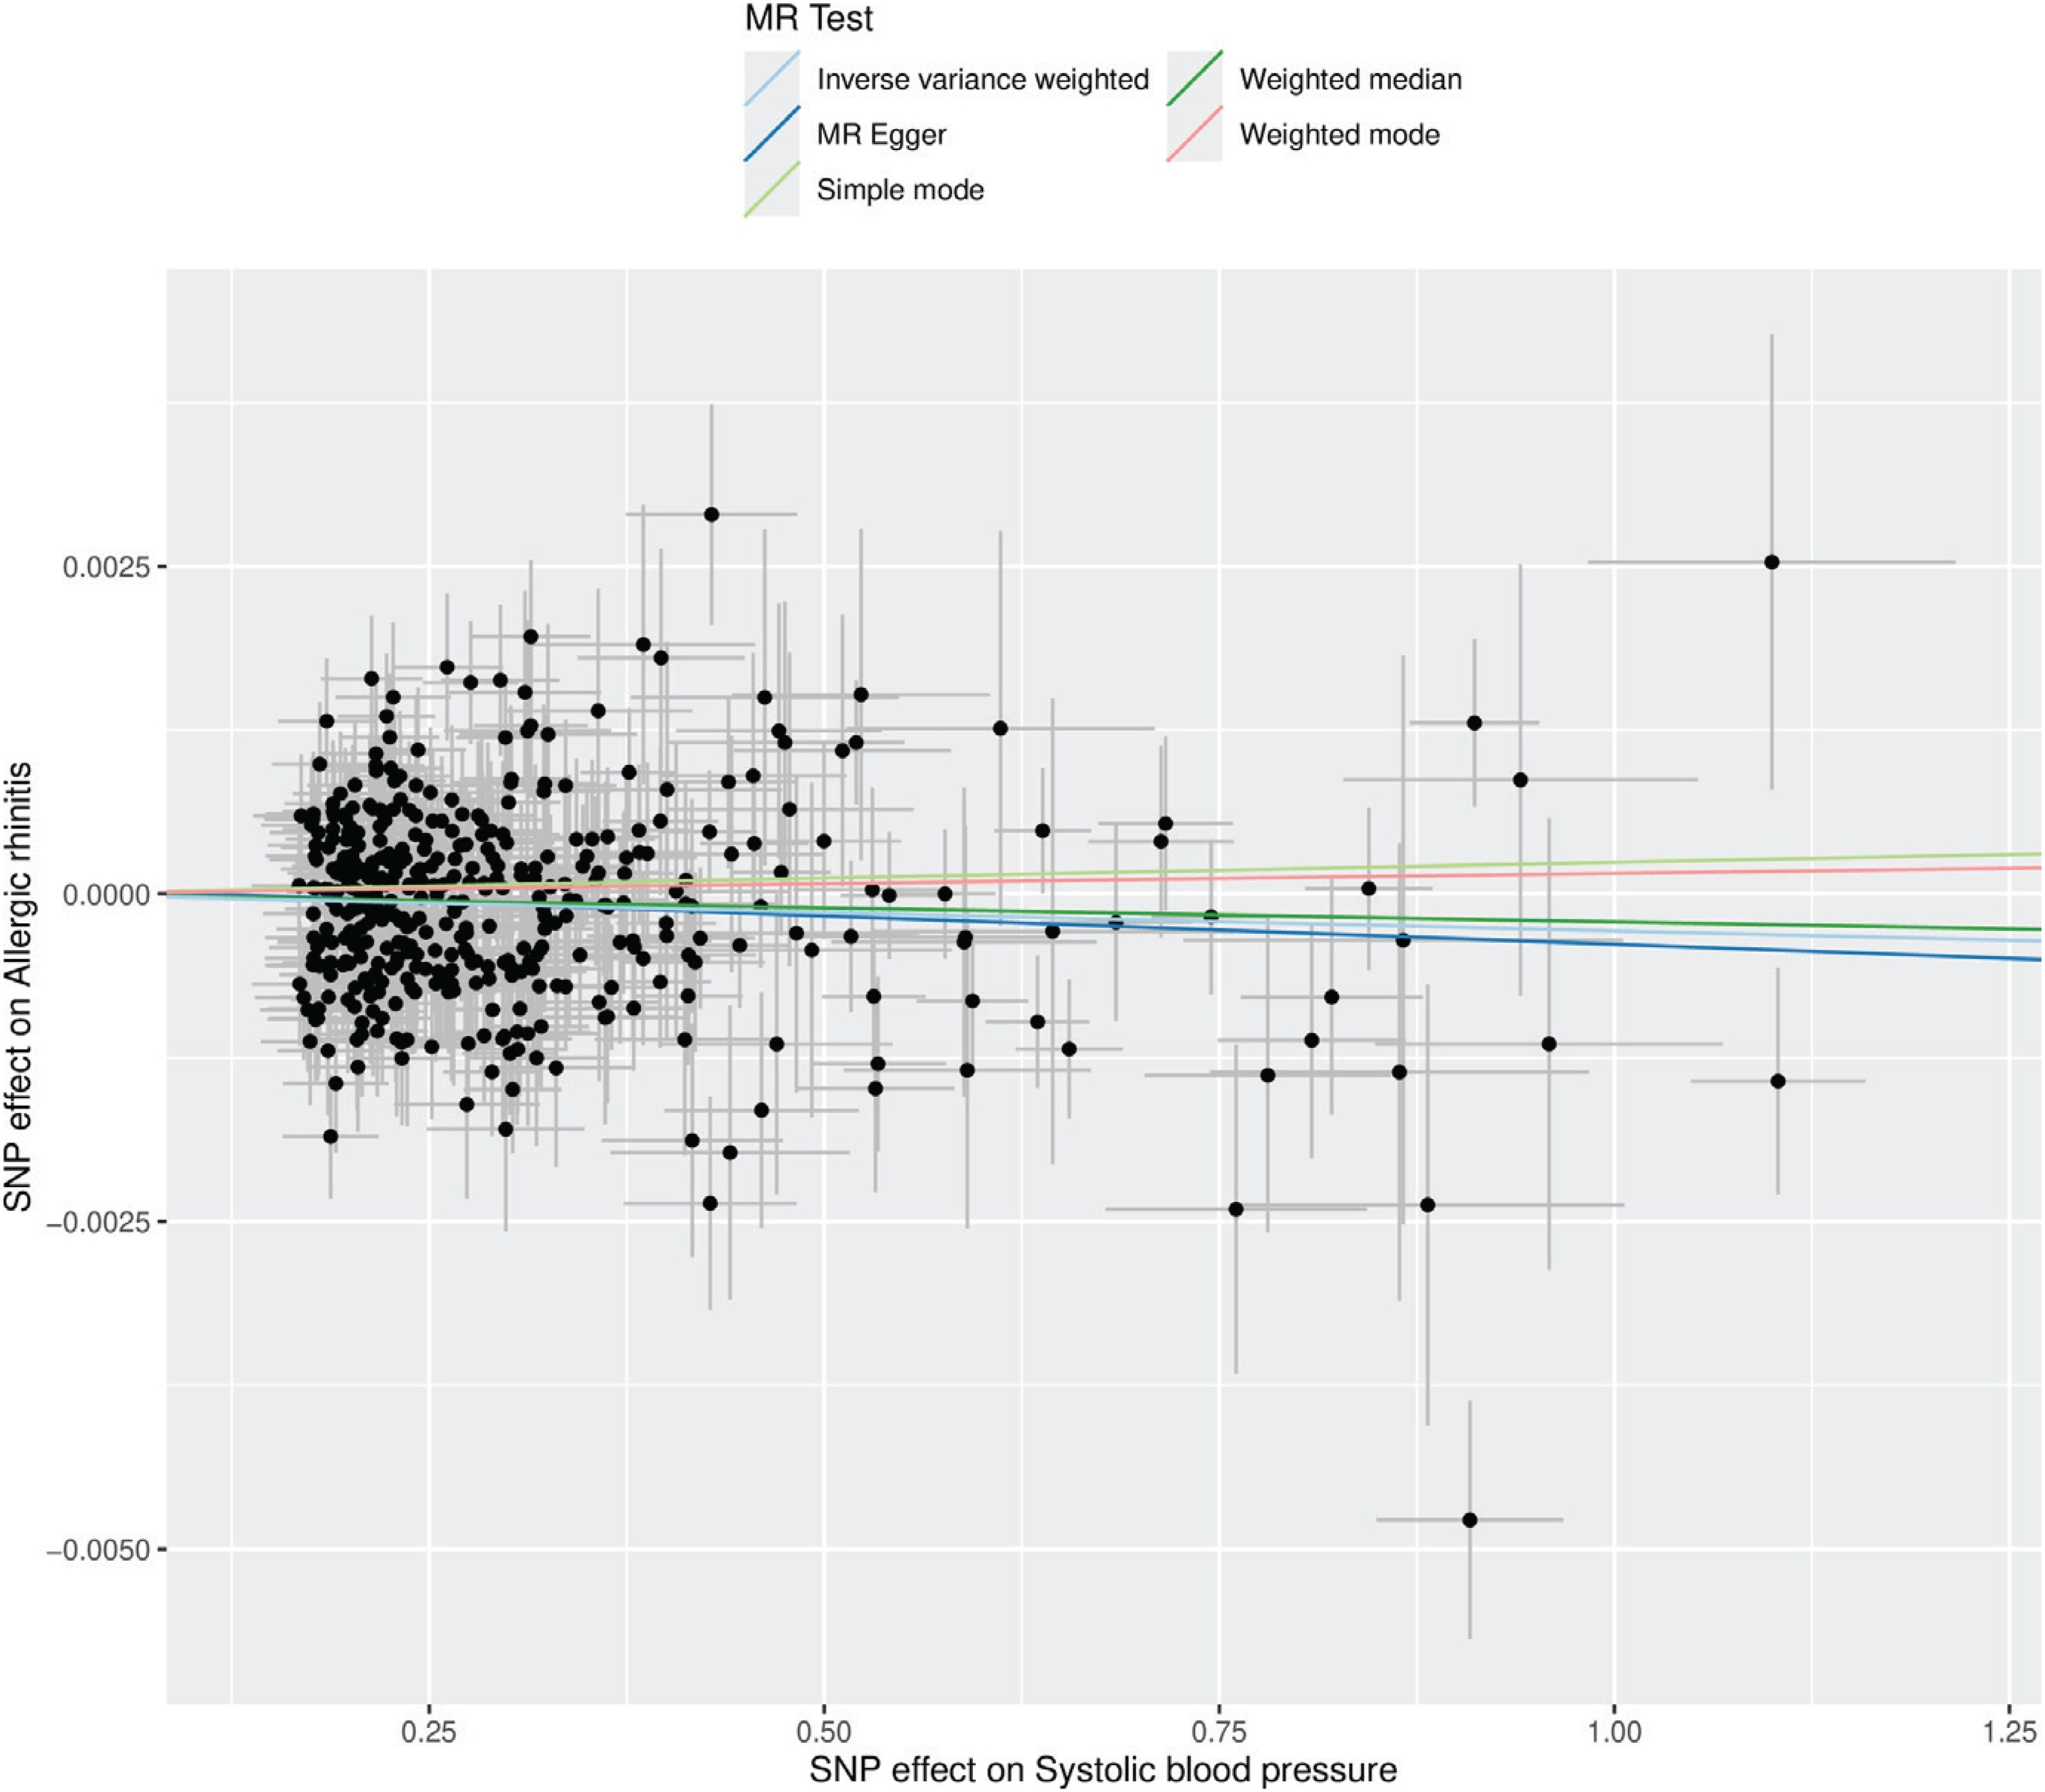
The effect of SBP on the risk of AR was evaluated using multiple MR methods. As shown in Table 2, the IVW method indicated a statistically significant inverse association, suggesting that lower genetically predicted SBP is associated with an increased risk of AR (OR=0.9997; 95% CI: 0.9995–0.9999). This trend was corroborated by the weighted median estimator (OR=0.9998; 95% CI: 0.9995–1.0001) and MR-Egger regression (OR=0.9996; 95% CI: 0.9990–1.0001), though the latter did not reach statistical significance. These findings are visually represented in the forest plot (Figure 3) and scatter plot (Figure 4).
Table 2
Associations between genetically determined MR analysis of exposures with outcomes, IEU OpenGWAS 2018 and 2021 (N=1242119)
Figure 3
Forest plot of single-nucleotide polymorphisms (SNPs) associated with SBP and the risk of AR. Black points represent the log odds ratio (OR) for systolic blood pressure per standard deviation (SD) decrease in allergic rhinitis, data from 2018 and 2021 (N=7088083 for SBP; N=9587836 for AR)
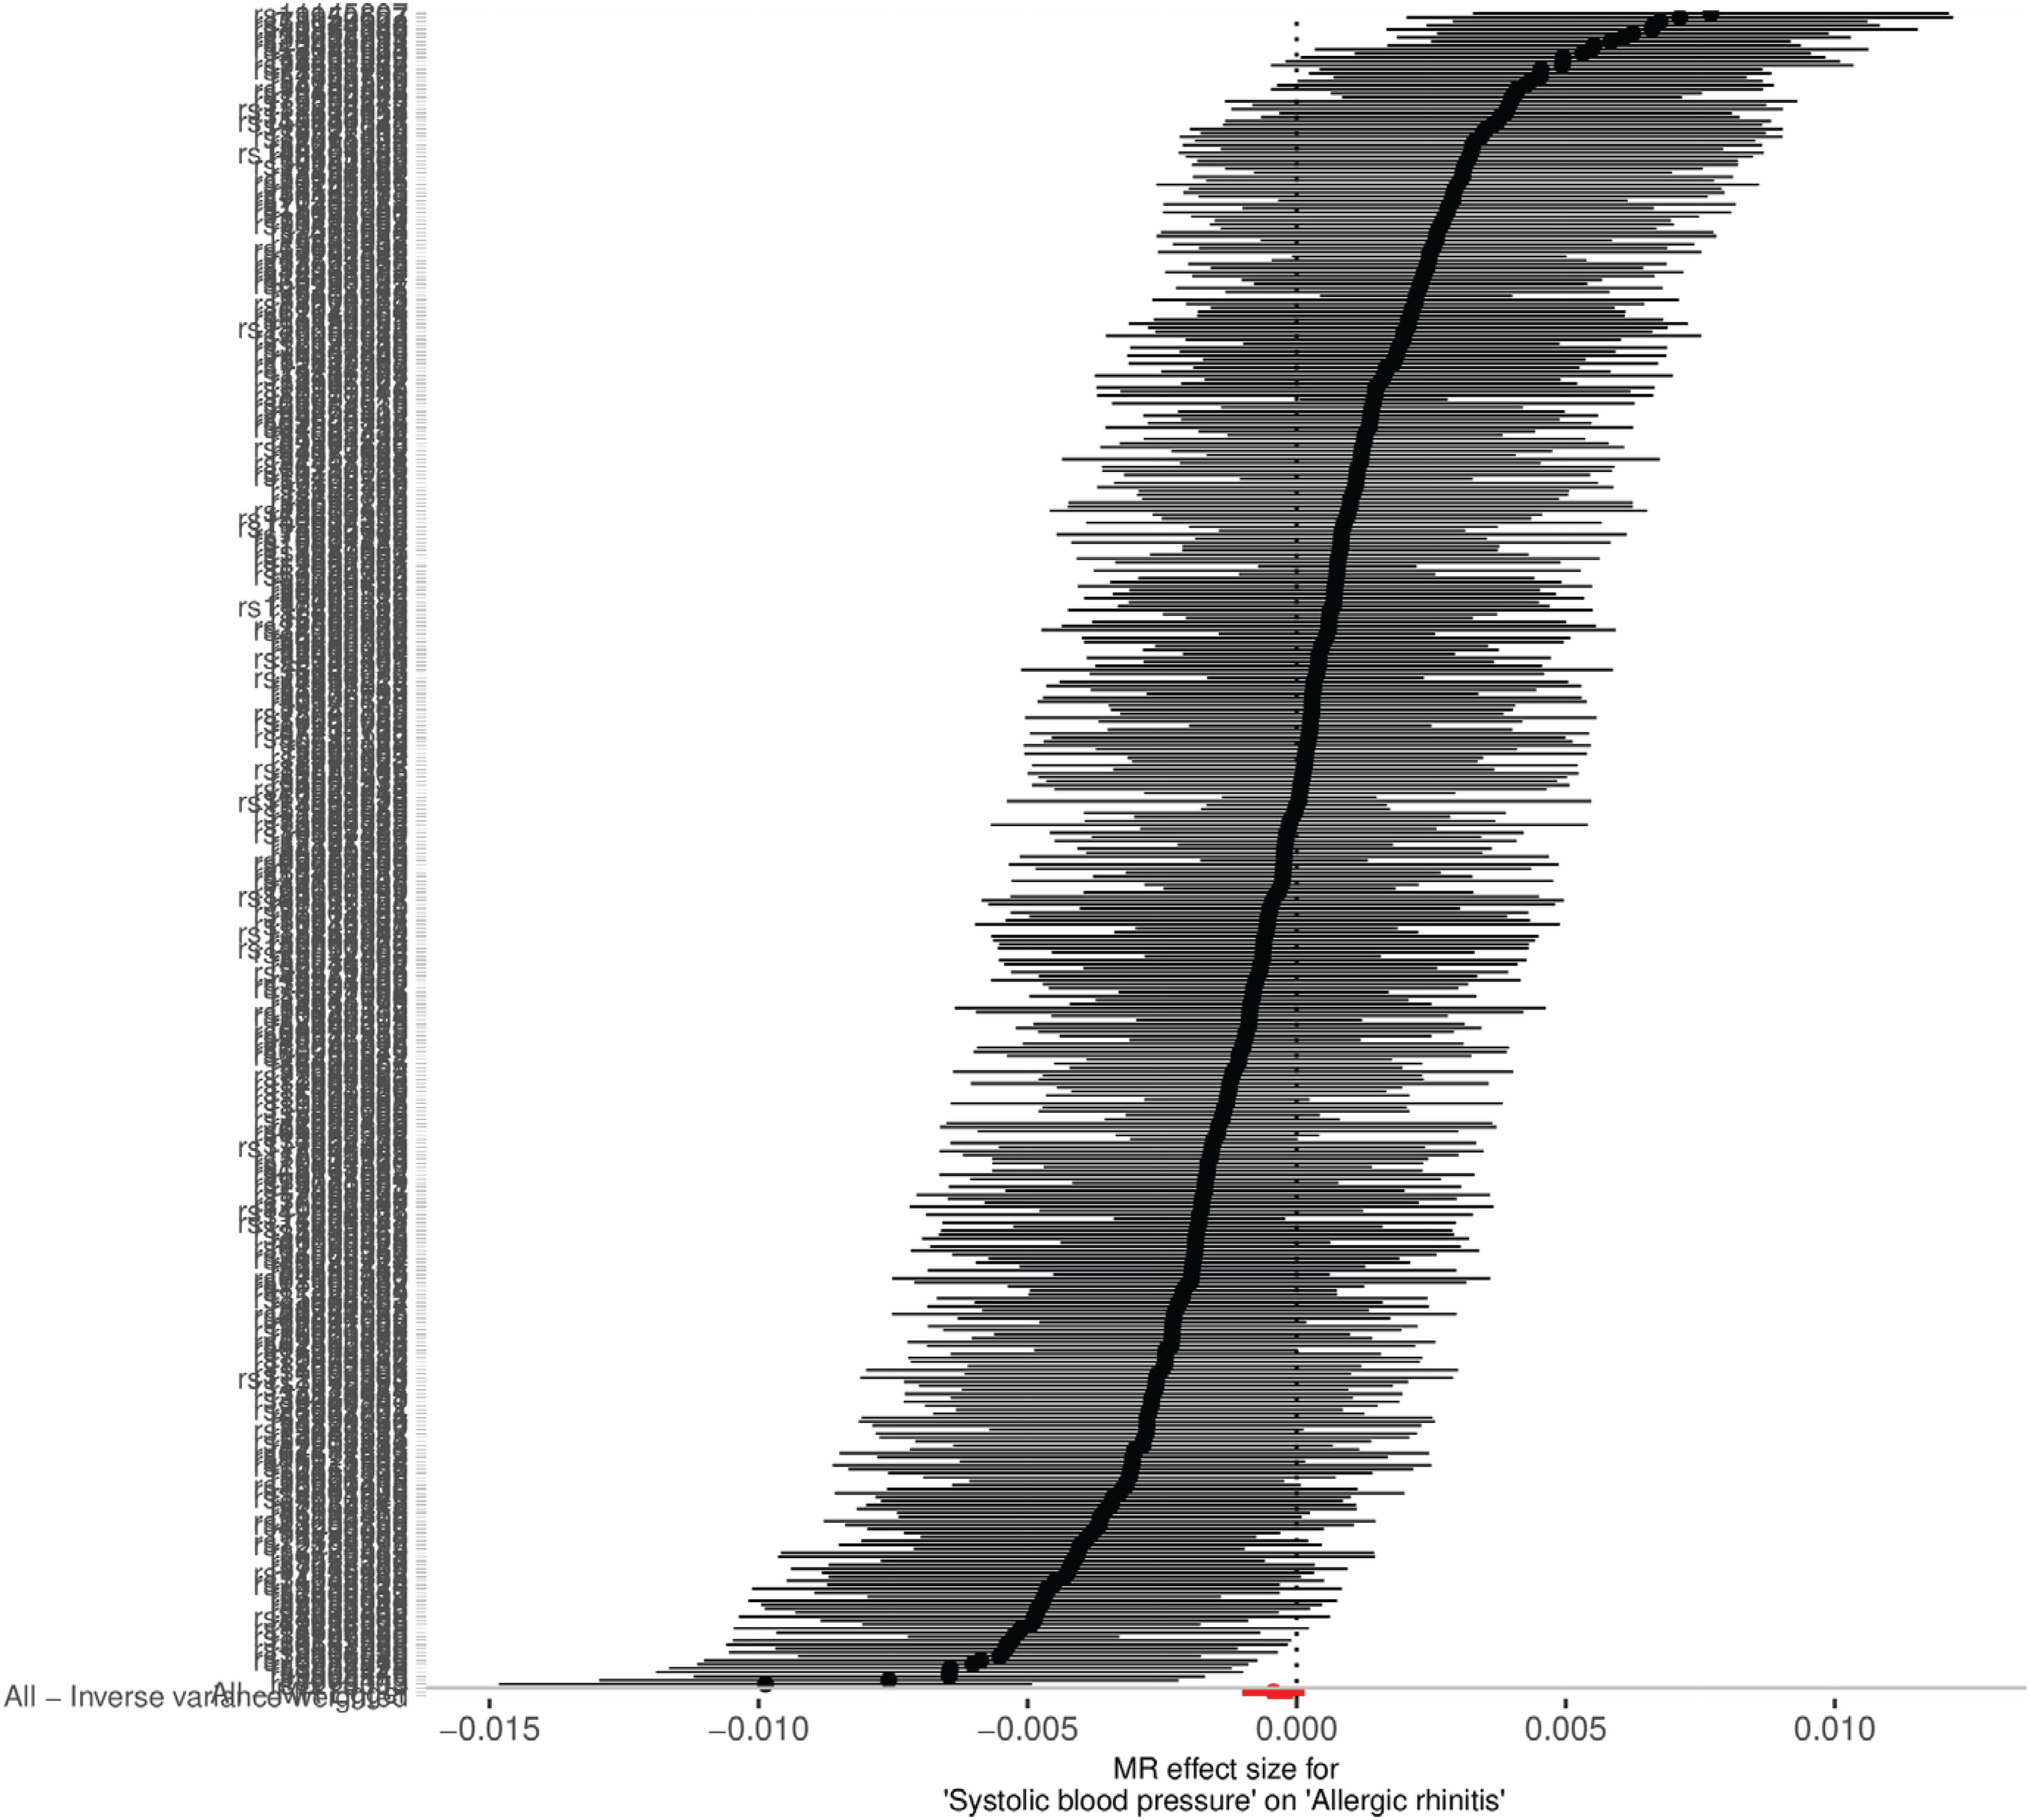
Figure 4
Scatter plot of SNP effect estimates for systolic blood pressure on the x-axis (in standard deviation units) versus allergic rhinitis on the y-axis (log odds ratio), including 95% CI. The regression slopes correspond to estimates from inverse-variance weighted (IVW), weighted median, and MR-Egger analyses. IEU OpenGWAS 2018 and 2021 (N=1242119)
Sensitivity analysis
Assessment of directional pleiotropy using MR-Egger regression revealed no significant evidence of bias (intercept=0.000047, SE=0.000087, p=0.587), as shown in Table 3. Although Cochran’s Q test indicated the presence of heterogeneity among the instrumental variables in both the IVW and MR-Egger analyses, the overall estimates remained stable. Furthermore, leave-one-out sensitivity analysis demonstrated that no single SNP exerted a disproportionate influence on the estimate, thereby affirming the robustness of the findings (Supplementary file Figure 1).
Table 3
Heterogeneity and pleiotropy analyses, IEU OpenGWAS 2018 and 2021 (N=1242119)
Reverse mendelian randomization analysis
To explore the potential reverse association between AR and SBP, a bidirectional MR analysis was conducted. After removing the SNP rs6771917, which was associated with the confounding trait ‘heart function’, a total of 29 independent SNPs significantly associated with AR (p<5×10⁻⁸) were included in the reverse analysis. As shown in Table 2, the IVW method revealed no evidence of an effect of genetically predicted AR on SBP. Similarly, MR-Egger and IVW-based Cochran’s Q statistics (Table 3) indicated no significant heterogeneity among the selected SNPs. The MR-PRESSO global test detected no statistically significant pleiotropy (p=0.053). Leave-one-out analysis further confirmed the robustness of the results, showing that exclusion of any individual SNP did not materially alter the outcome (Supplementary file Figure 2).
Additional mendelian randomization analysis
To determine whether the association between systolic blood pressure (SBP) and AR is independent of active or passive smoking, or whether smoking mediates or modifies this relationship, we conducted additional Mendelian randomization analyses to assess the causal effects of smoking on SBP and on AR. However, no evidence of a relationship was identified between smoking and SBP or between smoking and AR. (Supplementary file Table 3).
DISCUSSION
Tobacco control is a global public health priority, and passive smoking remains a major environmental health hazard, particularly in indoor environments and among vulnerable populations such as children, pregnant women, and non-smoking adults25. Tobacco smoke contains thousands of chemicals, including nicotine, tar, and formaldehyde. Their exposure induces oxidative stress and promotes the release of pro-inflammatory cytokines (e.g. IL-8, IL-6, IL-17, TNF-α), resulting in nasal mucosal injury, increased epithelial permeability, and excessive mucus secretion26. In allergic rhinitis (AR), secondhand smoke exposure is associated with reduced expression of tight junction (TJ) molecules, contributing to epithelial barrier disruption27. Moreover, secondhand smoke impairs ciliary motility, limiting clearance of secretions and foreign particles, thereby promoting persistent inflammation and chronic rhinitis symptoms such as nasal obstruction and purulent discharge28. Beyond these respiratory damages, the systemic inflammatory response triggered by secondhand smoke also exerts adverse effects on cardiovascular function, as active and passive smoking have been associated with subtle but significant increases in SBP among adolescents and adults29.
Lee et al.30 reported an inverse association between AR and diabetes mellitus, suggesting potential heterogeneity in allergic disease–metabolic disease interactions. In a large-scale, population-based study involving 30590 Korean participants, the prevalence of AR was significantly lower among individuals with metabolic syndrome, with an odds ratio (OR) of 0.84 (95% CI: 0.76–0.93). Similarly, individuals with hypertension exhibited a reduced prevalence of AR (OR=0.85; 95% CI: 0.77–0.94), and those with impaired fasting glucose demonstrated a lower AR prevalence (OR=0.81; 95% CI: 0.73–0.89), further supporting a potential inverse correlation between AR and metabolic or cardiovascular conditions9.
A similar MR study has suggested that AR may have a protective effect against hypertension15. However, that study has notable limitations, including a small sample size and a lack of adjustment for potential confounders. In the present study, we employed a bidirectional, two-sample MR approach using summary statistics from large-scale GWAS to investigate the potential relationship between SBP and AR. This represents the most extensive MR study to date evaluating the impact of SBP-related genetic variants on AR risk. In our forward MR analysis, we rigorously selected 421 SNPs significantly associated with SBP (p<5×10⁻⁸) as IVs. These SNPs were chosen based on strict criteria to minimize pleiotropic effects, employing the FastTraitR package to exclude variants associated with known confounders, including calcium channel blocker use and cigarette smoking interaction. All IVs demonstrated adequate strength, with F-statistics exceeding the conventional threshold of 10. The primary MR analysis utilized three complementary methods: IVW, weighted median, and MR-Egger regression, all of which consistently suggested a potential inverse association between genetically predicted SBP and the risk of AR. Sensitivity analyses revealed no significant pleiotropy or outlier influence, and the use of two independent GWAS datasets enhanced the robustness of the findings. In contrast, the reverse MR analysis, using AR-associated SNPs as IVs (after removing confounding SNPs such as rs6771917), provided no evidence supporting an effect of AR on SBP, thus reinforcing the directionality of the observed association.
MR methodologies offer several advantages over conventional observational studies by mitigating issues such as reverse causality and unmeasured confounding. However, the biological mechanisms underpinning the association between reduced SBP and increased AR susceptibility remain poorly understood. According to the 2023 classification guidelines for allergic diseases issued by the European Academy of Allergy and Clinical Immunology (EAACI), allergic diseases are categorized into seven distinct types based on underlying immunological mechanisms31. Recent studies suggest that damage to the nasal mucosa caused by hypoperfusion may recruit eosinophils to promote repair of the injured tissue, with the resulting type II inflammation potentially exacerbating the progression of rhinitis32. Additionally, low perfusion of the nasal epithelium may drive polarization of M0 macrophages toward the M2 phenotype, further promoting the development of rhinitis33. Histamine, in particular, binds to H1 receptors to induce vasoconstriction and increased vascular permeability, both of which are relevant in the context of cardiovascular inflammation34. These inflammatory processes have been implicated in the development of myocardial remodeling and other CVDs35-38. Calcium-permeable ion channels, which constitute the pharmacological targets of many antihypertensive agents, have been implicated in the exacerbation of rhinitis through their blockade39. To minimize confounding by these mechanisms, we applied the FastTraitR package to exclude twenty SNPs associated with calcium channel blocker usage from our SBP instrument set, and we removed the SNP rs6771917 from the allergic rhinitis AR dataset due to its association with cardiac function.
Strengths and limitations
Our MR framework leveraged summary statistics from large-scale GWAS and meta-analyses to achieve rigorous control of confounding and to mitigate reverse associations. These comprehensive datasets provided substantial statistical power and extensive genomic coverage. Nevertheless, several limitations merit consideration. First, European ancestry GWAS data, which may limit generalizability, and the absence of sex-specific SBP data in the database prevent assessment of differences between males and females. Second, unobserved pleiotropy cannot be addressed. Cochran’s Q test revealed notable heterogeneity among instrumental variables in both SBP and AR analyses under MR-Egger and inverse-variance weighted models, although this heterogeneity did not materially affect the estimates. Third, there may be potential violations of the MR assumptions. The two-sample MR design may be vulnerable to overidentification bias, potentially inflating SNP–exposure associations and gene-environment interactions not assessed. Fourth, there is a lack of relationships for diastolic blood pressure (DBP), mean blood pressure (MBP), or hypertension. The IEU Open GWAS database does not disaggregate SBP into distinct phenotypic subtypes, precluding subtype-specific inference regarding AR risk. Fifth, despite large sample sizes, heterogeneity led to wide confidence intervals and modest effect sizes. The effect of SBP on AR, though statistically robust, is limited in clinical utility and primarily offers theoretical insight into associations and multifactorial disease modeling rather than immediate practical application. Lastly, the lack of a significant association when we incorporated smoking as a moderating variable may be related to the definition of the smoking phenotype in the GWAS data and limitations in sample size.
In this study, MR analysis indicated that a 10 mmHg decrease in SBP is associated with an increased risk of AR (IVW, OR=0.997; 95% CI: 0.995–0.999). This effect may be modest, corresponding to only a 0.3% change in risk (1 minus 0.997), which is far below the conventional thresholds for clinically meaningful effects, such as an OR deviation of 0.1 or a risk change of ≥5%. This suggests that the impact is secondary and supportive rather than a primary determinant of AR onset or progression.
CONCLUSIONS
This bidirectional MR study provides evidence supporting a potential relationship between genetically predicted lower SBP and increased risk of AR, while excluding reverse causation. Although exposure to a smoking environment may not play a dominant role in the SBP–AR association, it may nonetheless interact with other factors to jointly exert a mediating or moderating effect on this association. These findings highlight the intricate interplay between immune regulation and cardiovascular physiology and underscore the need for further mechanistic and clinical investigations.