

INTRODUCTION
Cardiovascular disease (CVD) and cancer are the leading causes of morbidity and mortality worldwide1. CVD, including hypertension, coronary artery disease, cerebrovascular disease, and heart failure, accounted for approximately one-third of all deaths in 2015, and is estimated to be associated with nearly 18 million deaths worldwide2. Also, it is estimated that 9.6 million people died of various forms of cancer in 2017, making it the second leading cause of death after CVD3.
It is well known that tobacco use is the most important preventable cause of CVD4 and cancer5. Needless to say, smoking cessation is paramount to preventing the development and progression of CVD or cancer. However, quitting smoking is challenging and, unfortunately, many smokers continue smoking even after being diagnosed with CVD or cancer. Therefore, if there are disease-specific factors affecting quitting smoking, identifying these factors may be the first step in helping smokers with CVD or cancer.
Numerous studies have reported that various factors, such as physiological, behavioral, environmental, psychological, cognitive, and social factors, are involved in the success or failure of smoking cessation in the general population6,7. Previous studies have also investigated smoking cessation factors in CVD and cancer populations but with some limitations in, for example, study design, objectives, and population size8-14.
This study was conducted to explore the disease-specific factors associated with smoking cessation in adult male smokers with CVD or cancer, the two leading causes of death worldwide. To address the study objectives, the Korea National Health and Nutrition Examination Survey (KNHANES), nationally representative data, were analysed15. We first investigated smoking cessation-related factors in adult male smokers with CVD, cancer, or neither of the two. We then compared these factors between groups to probe potential interaction effects.
METHODS
Study design
This study analyzed data from the Korea National Health and Nutrition Examination Survey (KNHANES), from 2008–2019 (except 2013–2014 due to incomplete data). KNHANES, is an ongoing, nationwide, annual and population-based survey. It is a cross-sectional, multistage, stratified, and clustered probability sampling survey based on geographical region, age, and sex, which investigates the health, lifestyle, and eating habits of Koreans15. The survey consisted of three components: health interviews, health check-ups, and nutrition survey. The health interviews and check-ups were conducted by trained medical staff and interviewers at the mobile examination center. A week after the health interview and check-ups, nutritionists paid a visit to the participants’ homes for the nutrition survey. In addition, blood samples were collected at the mobile examination center in the morning after fasting for at least 8 hours.
Ethics considerations
The data were downloaded through a predetermined registration procedure. Prior to the survey, written informed consent was obtained from each study participant. The study was conducted in accordance with the guidelines of the Declaration of Helsinki. The institutional review board (IRB) of the Korea Disease Control and Prevention Agency (KDCA) reviewed and approved the KNHANES survey. The IRB approval numbers were 2008-04EXP-01-C, 2009-01CON-03-2C, 2010-02CON-21-C, 2011-02CON-06-C, 2012-01EXP-01-2C, 2018-01-03-P-A, and 2018-01-03-C-A.
Participants
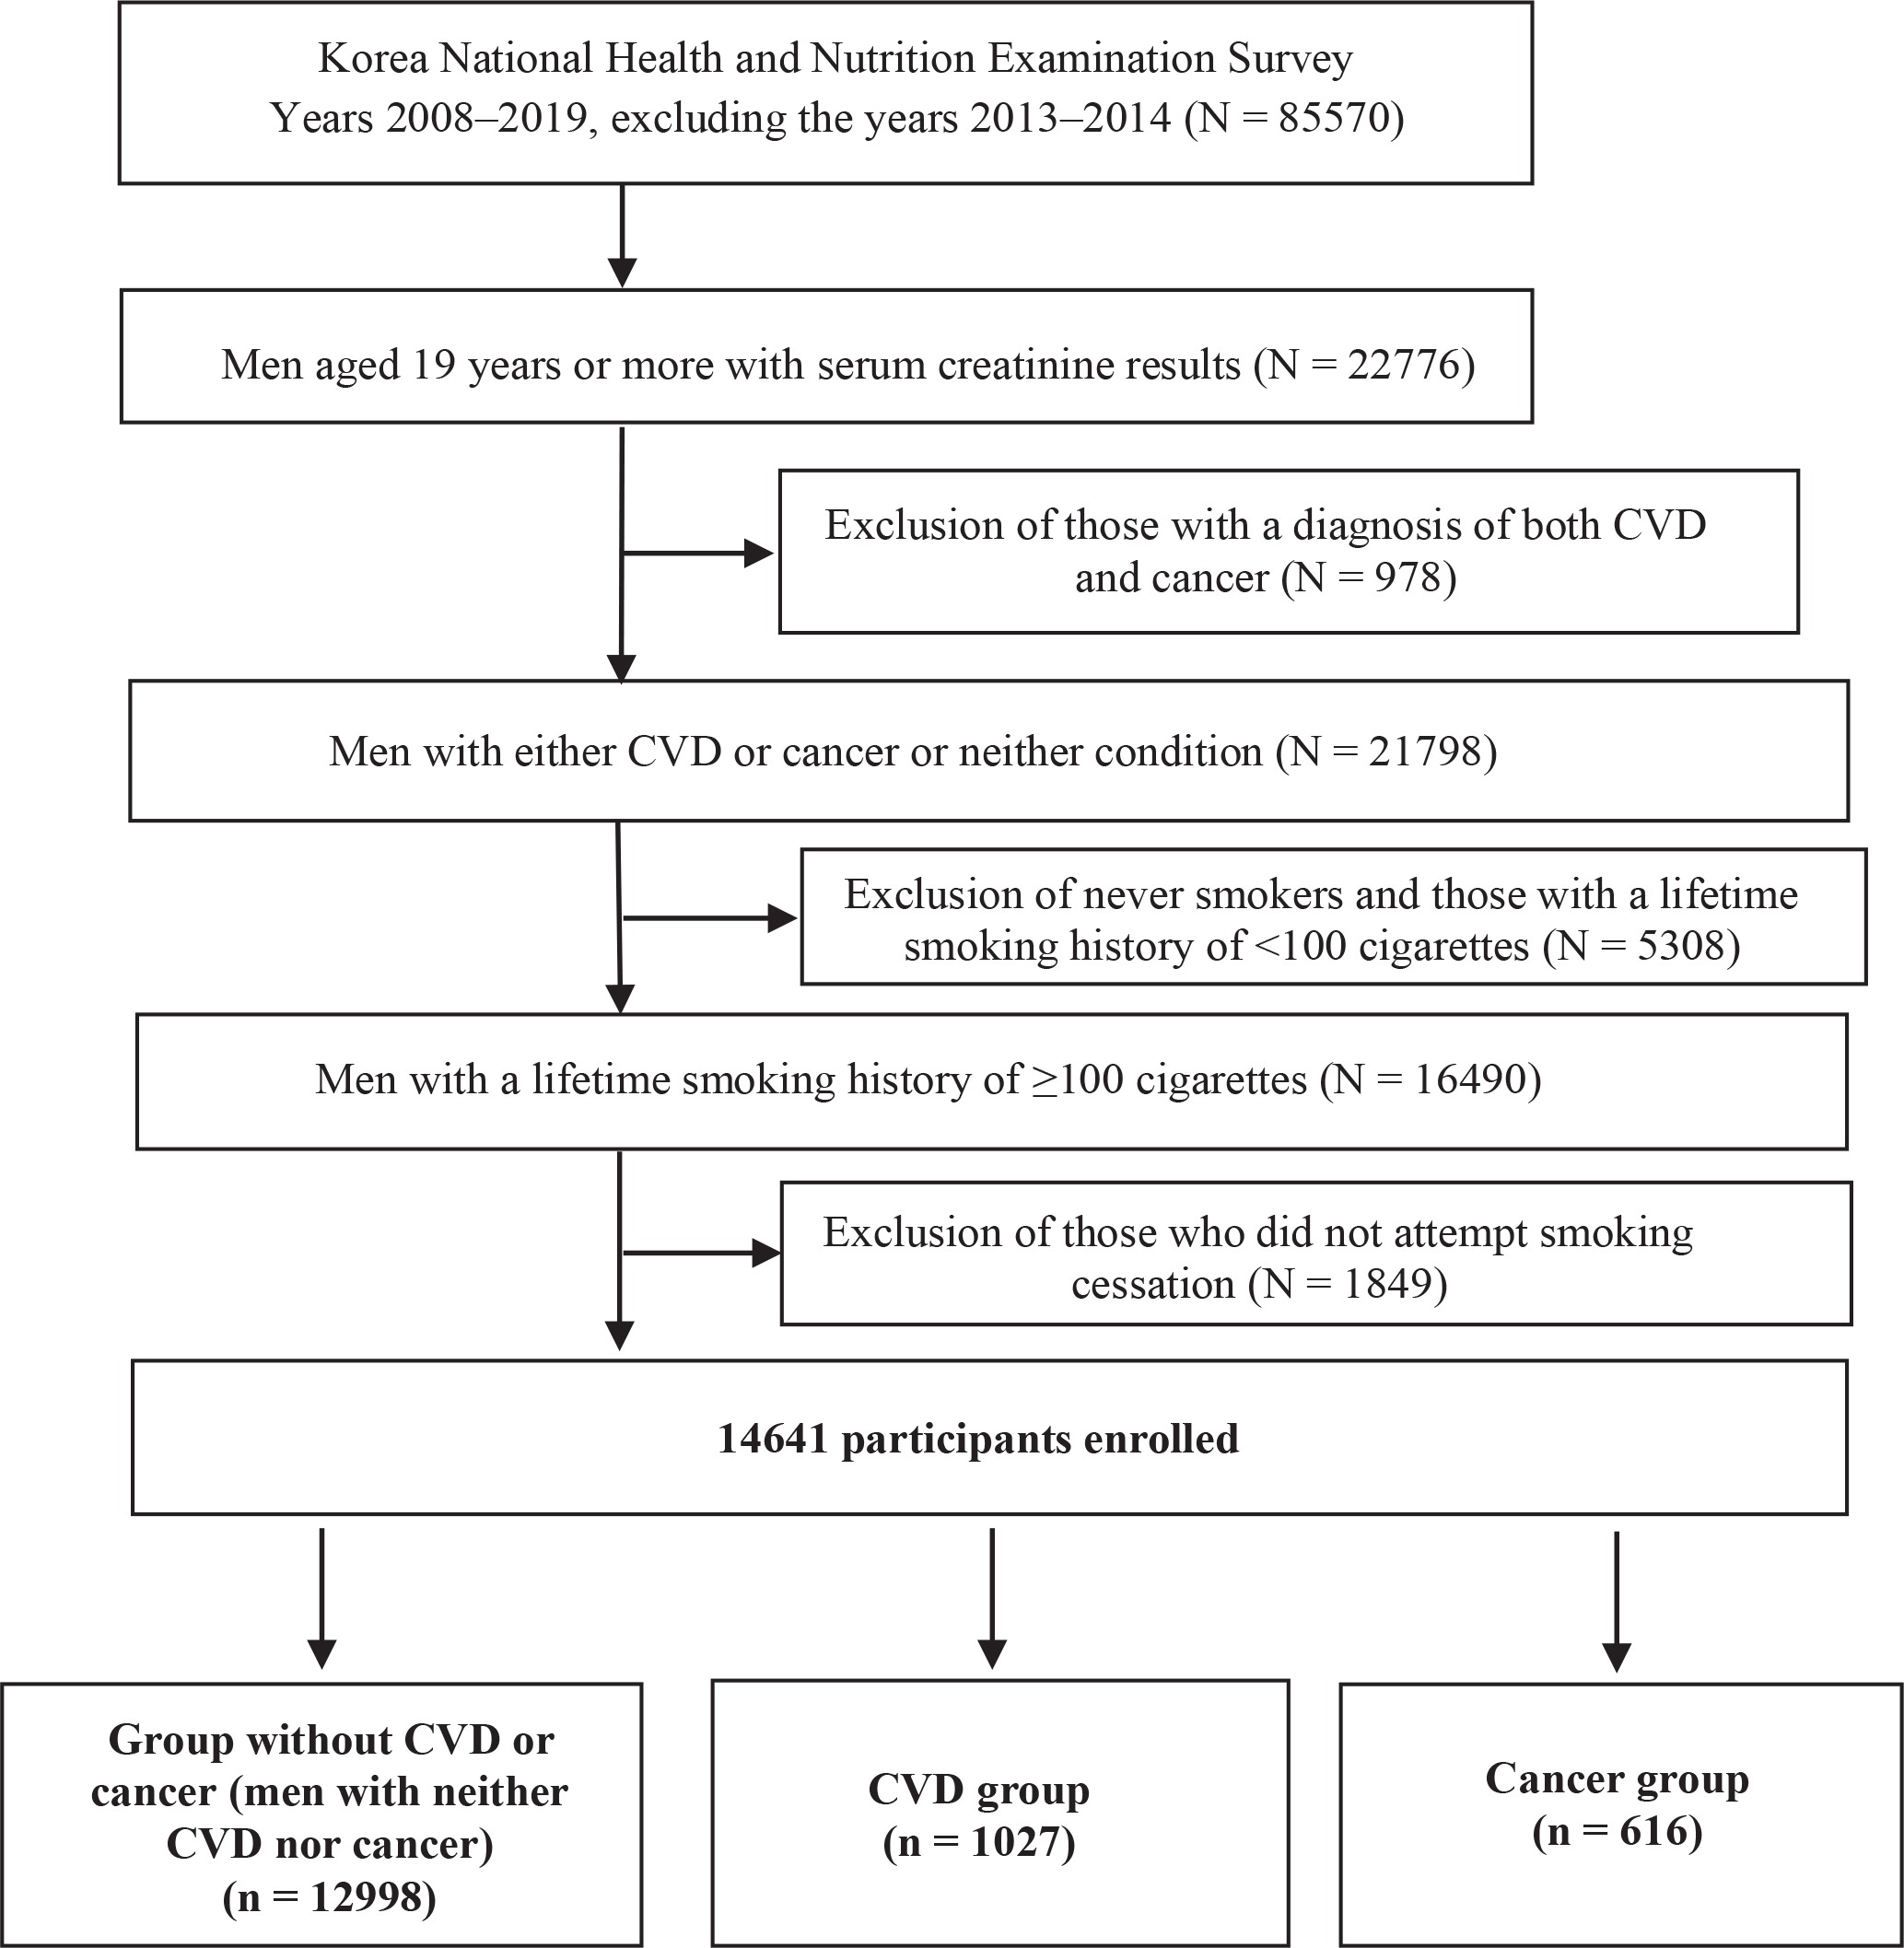
Men (aged ≥19 years) who have smoked more than 100 cigarettes in their lifetime and have tried to quit smoking in the past were included in the study. Among the 85570 people screened, 14641 people satisfying the study criteria were included in the study. The final study population consisted of 12998 men without CVD or cancer (hereafter referred to as ‘group without CVD or cancer’), 1027 men with CVD (hereafter, ‘CVD group’), and 616 men with cancer (hereafter, ‘cancer group’). People with both CVD and cancer were excluded. The criteria for people with CVD or cancer were based on diagnosis by a medical doctor.
Previous studies reported significant differences between self-reported smoking rates and those assessed by measuring of cotinine levels in Korean women, which might be due to social stigma and prejudice they face16-18. Smoking history in the KNHANES was determined relying on self-reported data; thus, this study included only men. Figure 1 demonstrates the flow diagram of the selection process and the number of study participants.
Definition and measurement of important variables
Several context-specific terms and definitions, largely in accordance with the CDC guidelines, were used in this study19,20. We used the term ‘successful quitters’ to refer to the participants who smoked at least 100 cigarettes to date but do not smoke any more (at the time of participation). The term ‘unsuccessful quitters’ describes the participants meeting the following three criteria at the time of participation: 1) the participant smoked at least 100 cigarettes to date; 2) the participant had tried to quit smoking at least once; and 3) the participant still smokes (tried quitting but failed to do so). In addition to current smoking status, additional smoking-related histories were obtained through the questionnaire, such as lifetime smoking amount (pack-years), exposure to secondhand smoke, and smoking cessation methods.
The survey included questions on exercise habits, alcohol consumption, health status, and perceived stress levels. To help the participants provide objective answers, the survey guidelines included examples and well-defined categories. Some questions, on the other hand, relied on their subjective perceptions. For example, ‘regular exercise’ was defined as exercising three times a week, each time for 20 minutes with high intensity or, alternatively, five times a week, each time for 30 minutes with moderate intensity. The definitions of ‘high’ and ‘moderate’ exercise intensities, however, were subjective; an exercise routine that is perceived as hard by the participant because it cannot be completed without getting physically exhausted was considered a ‘high intensity’ exercise. Swimming, heavy weightlifting, and running were considered vigorous exercise, while table tennis was listed as an example of moderate exercise.
Heavy drinkers were defined as those who consume seven or more drinks (regardless of alcohol type) per occasion at least twice a week. Perceived health (multiple levels ranging from very poor to very good), perceived psychological stress (moderate to severe subjective stress), and other parameters were defined as described previously15,21. Trauma history was defined as a history of at least one accident or intoxication that required hospitalization and/or emergency room treatment over the past year. Health behaviors refer to alcohol consumption frequency, exercise habits, and eating patterns. Quality of life (QoL) was measured using the EQ-5D system developed by EuroQoL. The EQ-5D index is a measure of health status comprising five dimensions: mobility, selfcare, usual activities, pain/discomfort, and anxiety/depression. The closer the score is to 1, the higher the quality of life. In addition, prevalence of anxiety and depression was also investigated19.
Statistical analysis
All data analyses were performed using SAS version 9.4 (SAS Institute, Inc., Cary, NC, USA), and the data were presented as mean ± standard error (SE) for continuous variables or as proportions ± SE for categorical variables. The prevalence of successful and unsuccessful quitters according to group was presented as a proportion. T-tests and chi-squared tests were conducted to assess the differences between groups for continuous and categorical variables, respectively.
Variables with p<0.1 in univariate analysis were used in multiple logistic regression analysis. Wald test with multiple logistic regression analyses was conducted to identify factors associated with smoking cessation in each group and the interaction effects between groups. The estimates for each interaction term between groups were obtained with the multiple logistic regression analysis adjusting for the involved variables such as age, marital status, occupation, household income, lifetime smoking amount, secondhand smoking, BMI, and smoking cessation methods. A p<0.05 or 95% confidence interval (CI) that did not span 1.0 was considered to indicate statistically significant differences. Data from the KNHANES were derived using stratified and multistage clustered probability sampling methods to represent the entire Korean population, so population weights were applied to the analyses15.
Wald test with multiple logistic regression analysis was conducted using the Korea National Health and Nutrition Examination Survey (KNHANES).
RESULTS
Prevalence of successful and unsuccessful quitters
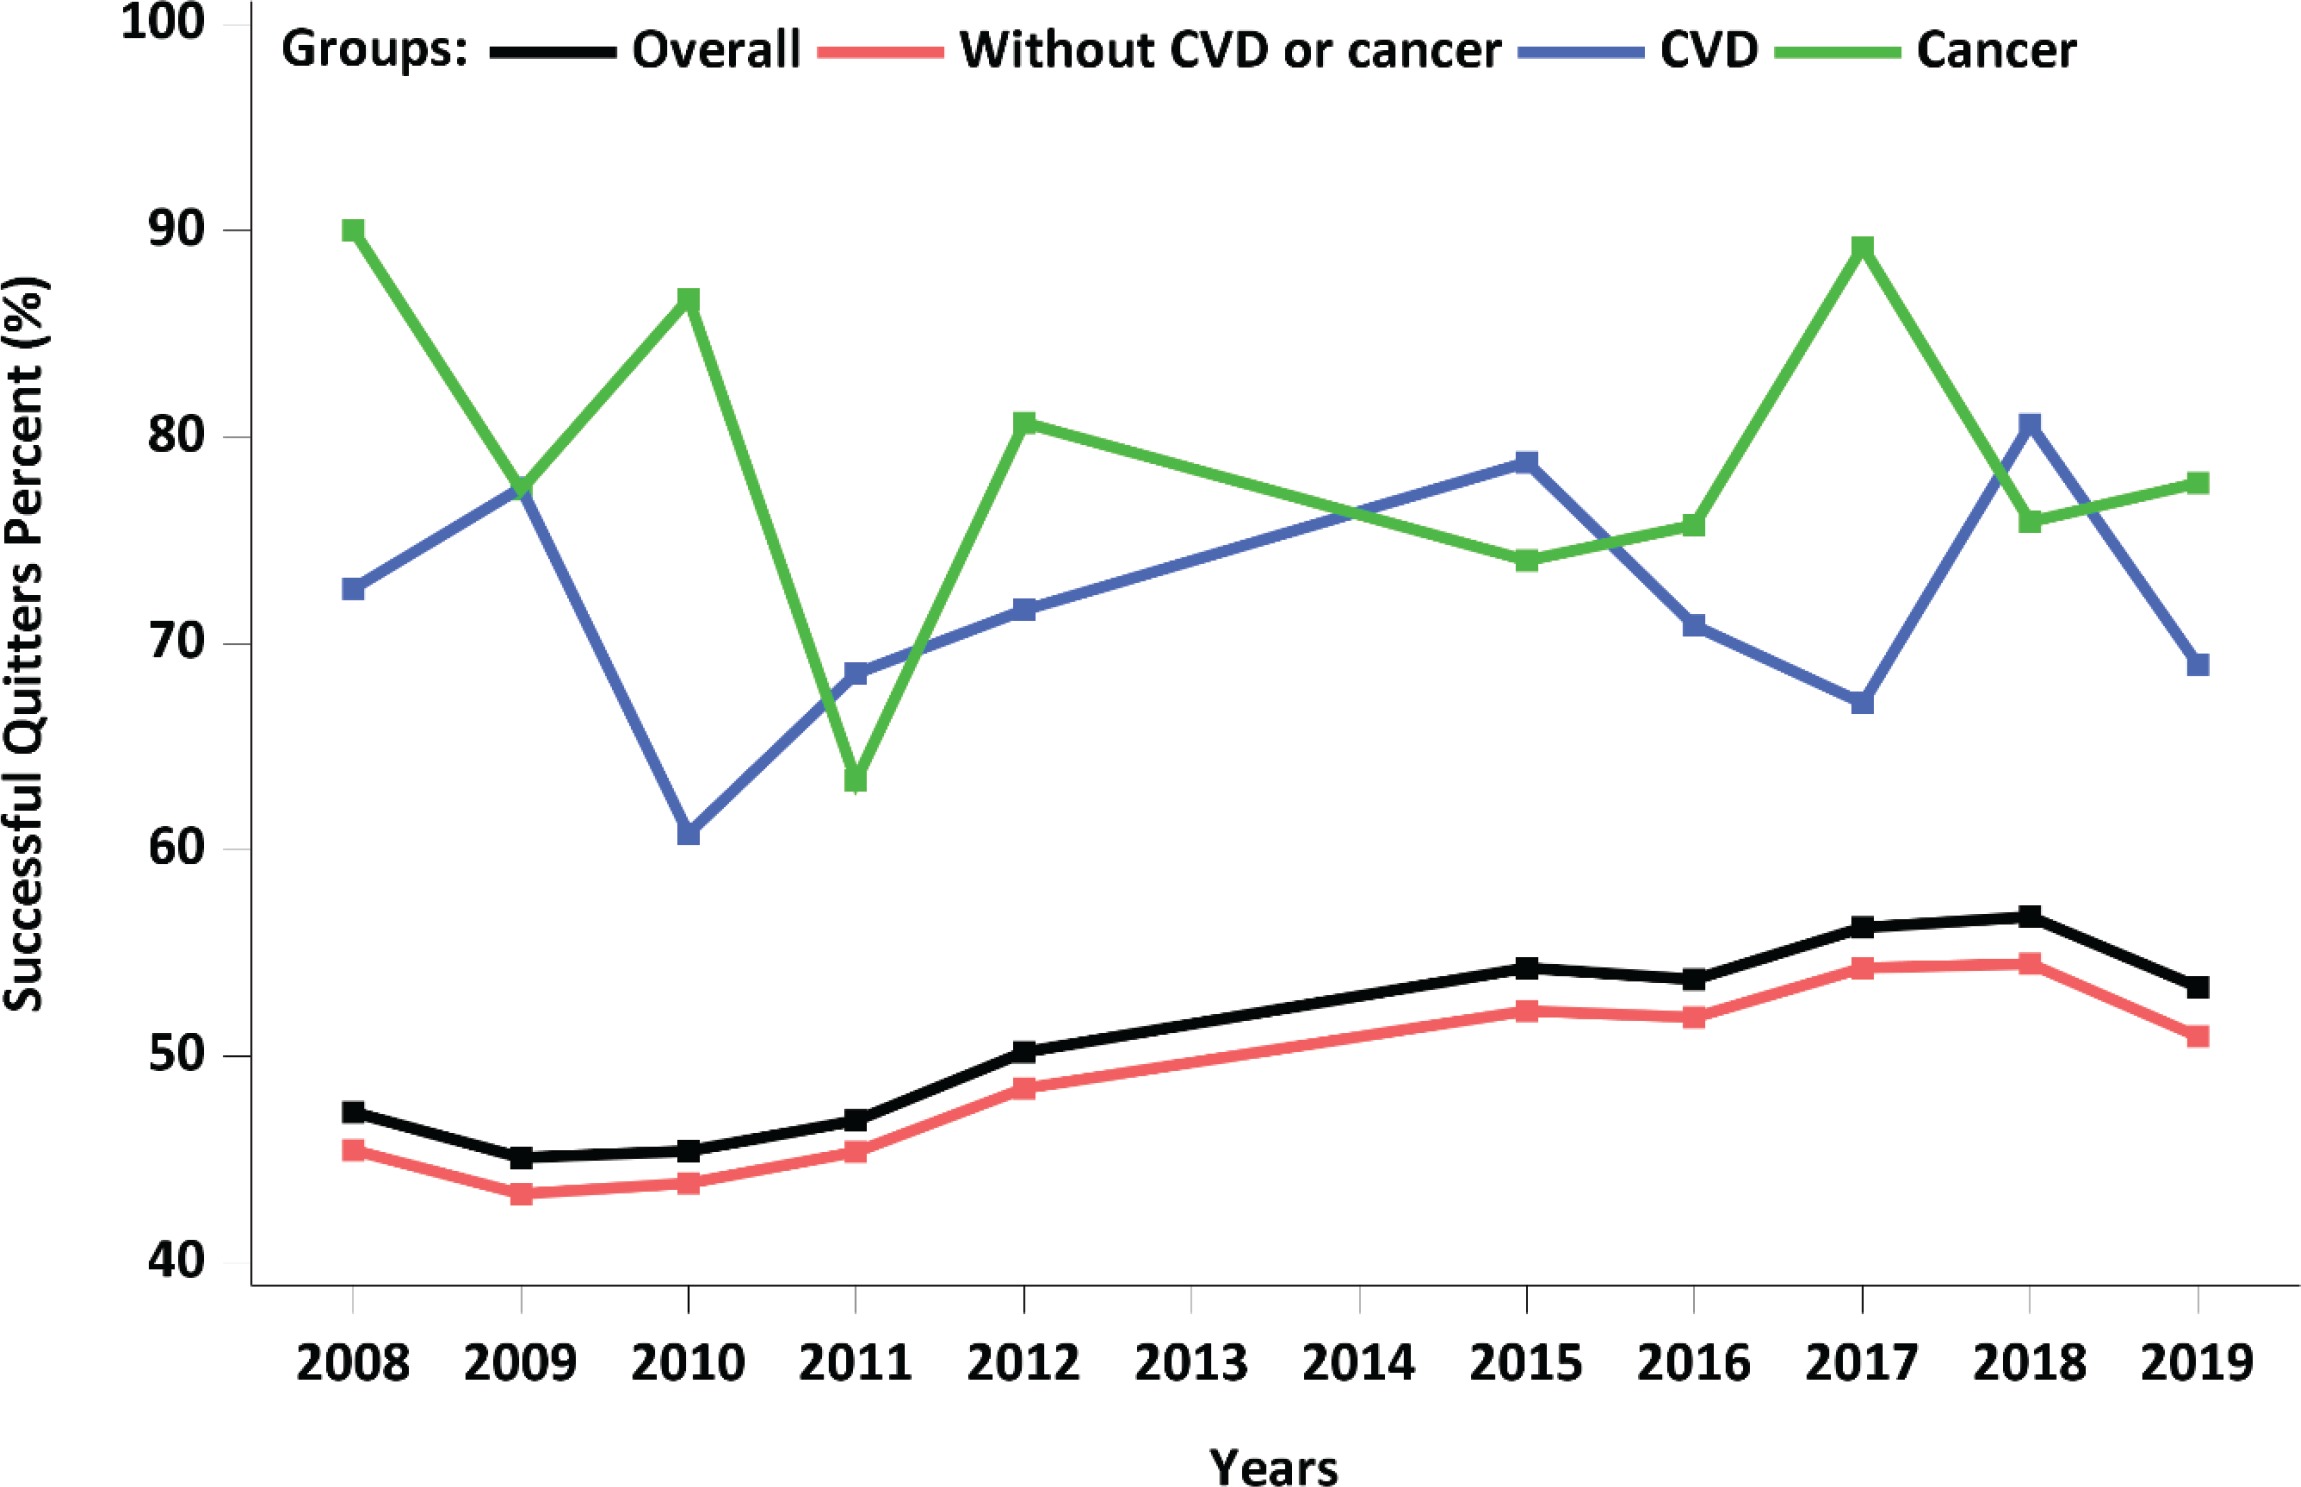
Table 1 and Figure 2 show the prevalence of successful and unsuccessful quitters by group. Among a total of 14641 participants, 1027 had CVD and 616 had cancer. Of the remaining 12998 participants without CVD or cancer, 7152 (weighted percentage: 48.9%) were successful in quitting smoking; 812 of 1027 individuals with CVD (weighted percentage: 71.7%) and 509 of 616 individuals with cancer (weighted percentage: 78.7%) were also successful in quitting smoking. Overall, quitting success rates in the CVD and cancer groups were consistently higher than that in the group without CVD or cancer. In addition, the cancer group tended to show a higher rate of success than the CVD group.
Table 1
Prevalence of successful and unsuccessful quitters in each group, Korea National Health and Nutrition Examination Survey (KNHANES) (N=14641)
| Total (N=14641) | Group without CVD or cancer (N=12998) | CVD (N=1027) | Cancer (N=616) | |||||||||
|---|---|---|---|---|---|---|---|---|---|---|---|---|
| Year | Successful quitters (n=8426)a | Unsuccessful quitters (n=6215)b | p | Successful quitters (n=7152)c | Unsuccessful quitters (n=5846)d | p | Successful quitters (n=765)e | Unsuccessful quitters (n=262)f | p | Successful quitters (n=509)g | Unsuccessful quitters (n=107)h | p |
| 2008 | 47.3 (1.50) | 52.7 (1.50) | <0.001 | 45.5 (1.57) | 54.5 (1.57) | <0.001 | 72.7 (6.08) | 27.3 (6.08) | 0.299 | 90.0 (4.09) | 10.0 (4.09) | 0.193 |
| 2009 | 45.1 (1.34) | 54.9 (1.34) | 43.3 (1.32) | 56.7 (1.32) | 77.5 (5.59) | 22.5 (5.59) | 77.4 (8.25) | 22.6 (8.25) | ||||
| 2010 | 45.4 (1.70) | 54.6 (1.70) | 43.8 (1.75) | 56.2 (1.75) | 60.8 (7.27) | 39.2 (7.27) | 86.7 (5.43) | 13.3 (5.43) | ||||
| 2011 | 46.9 (1.67) | 53.1 (1.67) | 45.4 (1.73) | 54.6 (1.73) | 68.5 (5.67) | 31.5 (5.67) | 63.3 (9.97) | 36.7 (9.97) | ||||
| 2012 | 50.2 (1.62) | 49.8 (1.62) | 48.4 (1.69) | 51.6 (1.69) | 71.6 (6.70) | 28.4 (6.70) | 80.7 (6.27) | 19.3 (6.27) | ||||
| 2015 | 54.3 (1.52) | 45.7 (1.52) | 52.2 (1.64) | 47.8 (1.64) | 78.8 (4.50) | 21.2 (4.50) | 74.0 (6.82) | 26.0 (6.82) | ||||
| 2016 | 53.7 (1.86) | 46.3 (1.86) | 51.9 (1.95) | 48.1 (1.95) | 70.8 (5.37) | 29.2 (5.37) | 75.7 (5.95) | 24.3 (5.95) | ||||
| 2017 | 56.2 (1.66) | 43.8 (1.66) | 54.3 (1.80) | 45.7 (1.80) | 67.1 (5.23) | 32.9 (5.23) | 89.2 (4.10) | 10.8 (4.10) | ||||
| 2018 | 56.8 (1.42) | 43.2 (1.42) | 54.5 (1.54) | 45.5 (1.54) | 80.6 (4.40) | 19.4 (4.40) | 75.9 (7.38) | 24.1 (7.38) | ||||
| 2019 | 53.4 (1.63) | 46.6 (1.63) | 50.9 (1.63) | 49.1 (1.63) | 69.0 (5.25) | 31.0 (5.25) | 77.8 (5.54) | 22.2 (5.54) | ||||
Sociodemographic characteristics and smoking history
Table 2 shows the general characteristics and smoking history of the participants in each group by their smoking cessation status. In all groups, successful quitters were older and more likely to be married compared with the unsuccessful quitters. Lifetime smoking amount was significantly higher among successful quitters in the group without CVD or cancer, but the difference was minimal (p=0.023). Secondhand smoking exposure at home or at work was significantly higher among unsuccessful smokers in both the group without CVD or cancer and the CVD groups. In the cancer group, only secondhand exposure at work was significantly higher in unsuccessful smokers. The smoking cessation method was found to use more willpower among successful smokers in all groups.
Table 2
Sociodemographic characteristics and smoking history of participants, Korea National Health and Nutrition Examination Survey (KNHANES) (N=14641)
Clinical characteristics, health behaviors, perceived health, and quality of life
Table 3 shows the clinical characteristics, health behaviors, perceived health status perceptions, quality of life (QOL) in all groups according to quitting status. In the group without CVD or cancer, almost all variables significantly differed between successful and unsuccessful quitters, even though the differences were minimal. There were fewer number of variables that differed between successful and unsuccessful quitters in the CVD and cancer groups compared with the group without CVD or cancer. In most groups, the many variables related to health behaviors, psychological stress and health-related QoL were significantly worse in failed quitters.
Table 3
Clinical characteristics, health behaviors, perceived health, and quality of life of participants, Korea National Health and Nutrition Examination Survey (KNHANES) (N=14641)
Factors associated with smoking cessation
Table 4 shows the factors associated with smoking cessation. In the group without CVD or cancer, several factors were associated with successful smoking cessations. To name a few, old age, being married, higher household income, using willpower to quit, higher BMI, regular exercise, and some comorbidities were positively correlated with successful quitting. On the other hand, higher lifetime smoking amount, secondhand smoking, using smoking cessation methods other than willpower, unhealthy behaviors, poor perceived health, and psychological stress were negatively associated with successful smoking cessation.
Table 4
Factors associated with smoking cessation in subgroups within the Korea National Health and Nutrition Examination Survey (KNHANES) datasets assessed
[i] The p-values were obtained by the Wald test with logistic regression. All estimates for all interaction terms between groups were obtained from the multiple logistic regression after adjustment for all age, marital status, household income, lifetime smoking amount, secondhand smoking, and smoking cessation methods. Diastolic blood pressure and waist circumference were omitted from the analysis because of multicollinearity. AOR: adjusted odds ratio. Ref: reference.
In both CVD and cancer groups, the number of factors associated with quitting smoking were lower than that in the group without CVD or cancer. Old age and the use of willpower were positively associated with successful quitting in the CVD group, whereas old age, being married, and employment in agriculture, fisheries, or labor were associated with successful smoking cessation in the cancer group. Interestingly, receiving education and counselling for quitting were negatively related to successful smoking cessation in both CVD and cancer groups. Using nicotine replacement therapy and secondhand smoking at home were also negatively associated with quitting in the CVD group. Calling a quitline was related to unsuccessful smoking cessation in the cancer group.
When interaction effects between the three groups were examined, household income was the only factor positively associated with successful smoking cessation in the group without CVD or cancer; smoking cessation rates were 1.17, 1.18, and 1.40 times higher, respectively, in participants in the second, third, and fourth (highest) percentiles of the income quartiles (p for interaction=0.023). On the other hand, higher lifetime total smoking amount was negatively associated with successful quitting in the group without CVD or cancer (AOR=0.85; 95% CI: 0.83–0.88; p for interaction <0.001). Perceived health status was also negatively associated with successful quitting, indicating that fair and poor/very poor health perception, compared with very good/good health perception, was negatively associated with successful smoking cessation in the group without CVD or cancer (AOR of fair perception, 0.76; 95% CI: 0.68–0.84; AOR of poor/very poor perception, 0.64; 95% CI: 0.55–0.75; p for interaction=0.035). No significant factor was detected related to smoking cessation in both the CVD and cancer groups when interaction effect was investigated.
DISCUSSION
This study investigated and compared factors related to smoking cessation in Korean male smokers with CVD, cancer, or neither. The quitting success rates in the CVD and cancer groups were consistently higher than those in the group without CVD or cancer throughout the study period (Table 1 and Figure 2). When we examined factors associated with the smoking cessation, fewer factors were related to smoking cessation in both the CVD and the cancer groups compared with the group without CVD or cancer. Old age and using willpower to quit in the CVD group, and old age, being married, and employment in agriculture, fisheries, or labor in the cancer group, were the only factors associated with quitting success. Interestingly, receiving education and counselling on quitting were negatively correlated with quitting success in both the CVD and the cancer groups. Using nicotine replacement therapy and secondhand smoke exposure in the CVD group, and calling a quitline in the cancer group were related to failure in quitting. In short, old age, being married, and the use of willpower were related to successful smoking cessation in the CVD and/or cancer groups. Methods of quitting other than willpower were associated with unsuccessful attempts of smoking cessation in either the CVD and/or cancer groups. We do not have a good explanation for this observation. The bottom line is that various smoking cessation methods, other than willpower in the CVD group, did not help smokers in the CVD and cancer groups quit smoking. This may simply implicate that willpower may be the most effective resource to quit smoking in these groups. Since the above factors were also significant factors in the group without CVD or cancer, there were no CVD-specific or cancer-specific differences other than the number of factors that are related to smoking cessation when compared to the group without CVD or cancer.
We also analyzed the interaction effects between the three groups. In the group without CVD or cancer, household income was the only factor positively associated with successful smoking cessation, and higher lifetime smoking amount and poorly perceived health status were the only factors negatively related to successful quitting. No significant factors were detected related to success or failure in quitting in both the CVD and cancer groups when interaction effects were investigated.
Overall, there seems to be no CVD-specific or cancer-specific factors that influence smoking cessation. However, given that the quitting success rates were higher in both the CVD and cancer groups over the study period, compared with the group without CVD or cancer, it can be speculated that having CVD or cancer was the main reason for quitting in this study population.
Continuous smoking among cancer survivors and patients with CVD is not uncommon although smoking cessation is one of the most important measures to prevent relapse of disease. The prevalence of smoking among cancer survivors has been reported to be between 9% and 33%20,22-28. Around 50% of smokers do not quit smoking even after a diagnosis of CVD12,13,29,30.
Several studies have examined the factors associated with continuous smoking in patients with cancer or CVD. To name a few, younger age, education level (lower), being uninsured, sex (male)8, younger age at cancer diagnosis, low socioeconomic status, heavy smoking, diagnosis of non-smoking related cancer, high serum glucose level9, nicotine withdrawal symptoms, pain, fatigue, nausea, depression, and anxiety10,11, have been reported as factors associated with continued smoking in cancer patients. A higher smoking amount and longer smoking duration before the diagnosis, were associated with persistent smoking after the diagnosis of CVD12. Having a life partner13 or participating in a cardiac rehabilitation14 were related to successful smoking cessation in the CVD patients. Overall, the factors reported to contribute to smoking cessation appear to vary depending on study settings or populations.
The factors associated with smoking cessation in the group without CVD or cancer were more or less the same as previously reported in the general population30-32. Among these significant factors, household income was the only factor positively associated with successful smoking cessation, and higher lifetime smoking amount and poorly perceived health status were the only factors negatively related to successful quitting in the group without CVD or cancer when the interaction effect between groups was investigated. Although these factors have already been reported to influence smoking cessation, it is quite intriguing that only these factors were found to be significant in the group without CVD or cancer when the interaction effect between groups was examined21,31-33. Future studies are needed to determine whether house income, lifetime smoking amount, and health status perception become more important to smokers without CVD or cancer for quitting smoking.
Limitations
This study has some limitations. Factors influencing smoking cessation in cancer survivors are known to be related to the type of tumor, the causal relationship between smoking and the diagnosed cancer, and the nature of cancer treatment34,35. It is also possible that the quitting success varies according to the type or treatment of CVD. However, such detailed clinical information was not available for analysis. In addition, the data on when the participants stopped smoking and when they were diagnosed with cancer or CVD were not available. We presumed that being diagnosed with CVD or cancer was the main reason for quitting in this study population. Therefore, the timing of quitting in relation to the timing of CVD or cancer diagnosis, if known, could provide a stronger support for our conclusions.
CONCLUSIONS
The quitting success rates in the CVD and cancer groups were consistently higher than those in the group without CVD or cancer throughout the study period. However, no disease-specific factors influencing smoking cessation were detected in the participants with CVD or cancer in this study population. Given that smoking cessation success rates were consistently higher in both the CVD and cancer groups than in the group without CVD or cancer, being diagnosed with CVD or cancer itself could be inferred as the motive for quitting smoking. Therefore, it is important for healthcare providers to motivate smokers with CVD or cancer, by emphasizing the importance of quitting smoking.