

INTRODUCTION
Tobacco use and secondhand smoke (SHS) exposure are leading preventable causes of global morbidity and mortality1. In addition to established cardiopulmonary diseases – such as chronic obstructive pulmonary disease, cardiovascular events, and pulmonary malignancies – evidence indicates that tobacco exposure is associated with systemic toxicity2. This includes adverse effects on skeletal muscle, bone homeostasis, and neuroendocrine function3,4.
Accurate measurement of tobacco exposure is critical in epidemiological studies. Self-reported smoking data are subject to recall and reporting biases, and they often underestimate SHS exposure in non-smokers5. Consequently, researchers increasingly use objective biochemical markers. Serum cotinine is currently established as a standard biomarker for assessing systemic tobacco exposure6.
Cotinine, the primary hepatic metabolite of nicotine, has a half-life of 16–20 hours, compared to 2–4 hours for nicotine7. This stability minimizes the impact of episodic smoking on measured levels. Quantified via isotope-dilution high-performance liquid chromatography coupled with atmospheric pressure chemical ionization tandem mass spectrometry (ID HPLC-APCI MS/MS), serum cotinine provides a reliable measure of recent tobacco exposure8.
Serum cotinine concentrations are more stable than urinary levels, making serum the preferred matrix for population-based assessments. Elevated serum cotinine is associated with adverse outcomes in multiple systems, including neurocognitive function9, endocrine regulation10, and bone metabolism6.
Tobacco smoke generates reactive oxygen species (ROS) and reduces endogenous antioxidant defenses11,12. This redox imbalance can damage cellular macromolecules and activate pro-inflammatory signaling pathways, contributing to systemic tissue damage13. Experimental studies indicate that antioxidant interventions may mitigate nicotine-induced oxidative damage14, suggesting that oxidative stress is a key mechanism in tobacco-related pathology15.
Skeletal muscle is a critical determinant of metabolic health, physical function, and overall survival11. The age-related decline in muscle mass and function – sarcopenia – is associated with an increased risk of falls, fractures, disability, and mortality16.
Skeletal muscle relies on mitochondrial networks to meet its energy demands17. Tobacco smoke impairs mitochondrial respiration, reduces ATP synthesis, and increases ROS production, disrupting cellular energy homeostasis18. Additionally, it suppresses muscle protein synthesis and activates myostatin- and ubiquitin-proteasome-mediated proteolytic pathways, leading to protein catabolism19.
Chronic low-grade systemic inflammation activates NF-κB and MAPK signaling pathways in skeletal muscle20. Tobacco smoke exacerbates this inflammation via mechanisms such as HMGB1-mediated pyroptosis, contributing to myofiber degradation and muscle atrophy21. These pathways provide a biological basis for the association between tobacco exposure and skeletal muscle loss.
Diets with high inflammatory potential, measured by the Dietary Inflammatory Index (DII), are associated with lower muscle strength, reduced muscle mass, and increased sarcopenia risk22. Conversely, antioxidant-rich diets, assessed by the Composite Dietary Antioxidant Index (CDAI), may protect against oxidative damage in myofibers23. However, the interaction between diet and tobacco exposure on skeletal muscle remains unclear.
We hypothesized that dietary patterns modify the association between tobacco exposure and skeletal muscle mass. Specifically, we expected a stronger inverse association between serum cotinine and appendicular skeletal muscle mass index (ASMI) among individuals with pro-inflammatory diets, and an attenuated association among those with antioxidant-rich diets.
This study aimed to examine the association between serum cotinine and ASMI in a nationally representative sample of US adults. Additionally, we evaluated whether dietary inflammatory and antioxidant profiles mediate or modify this association.
METHODS
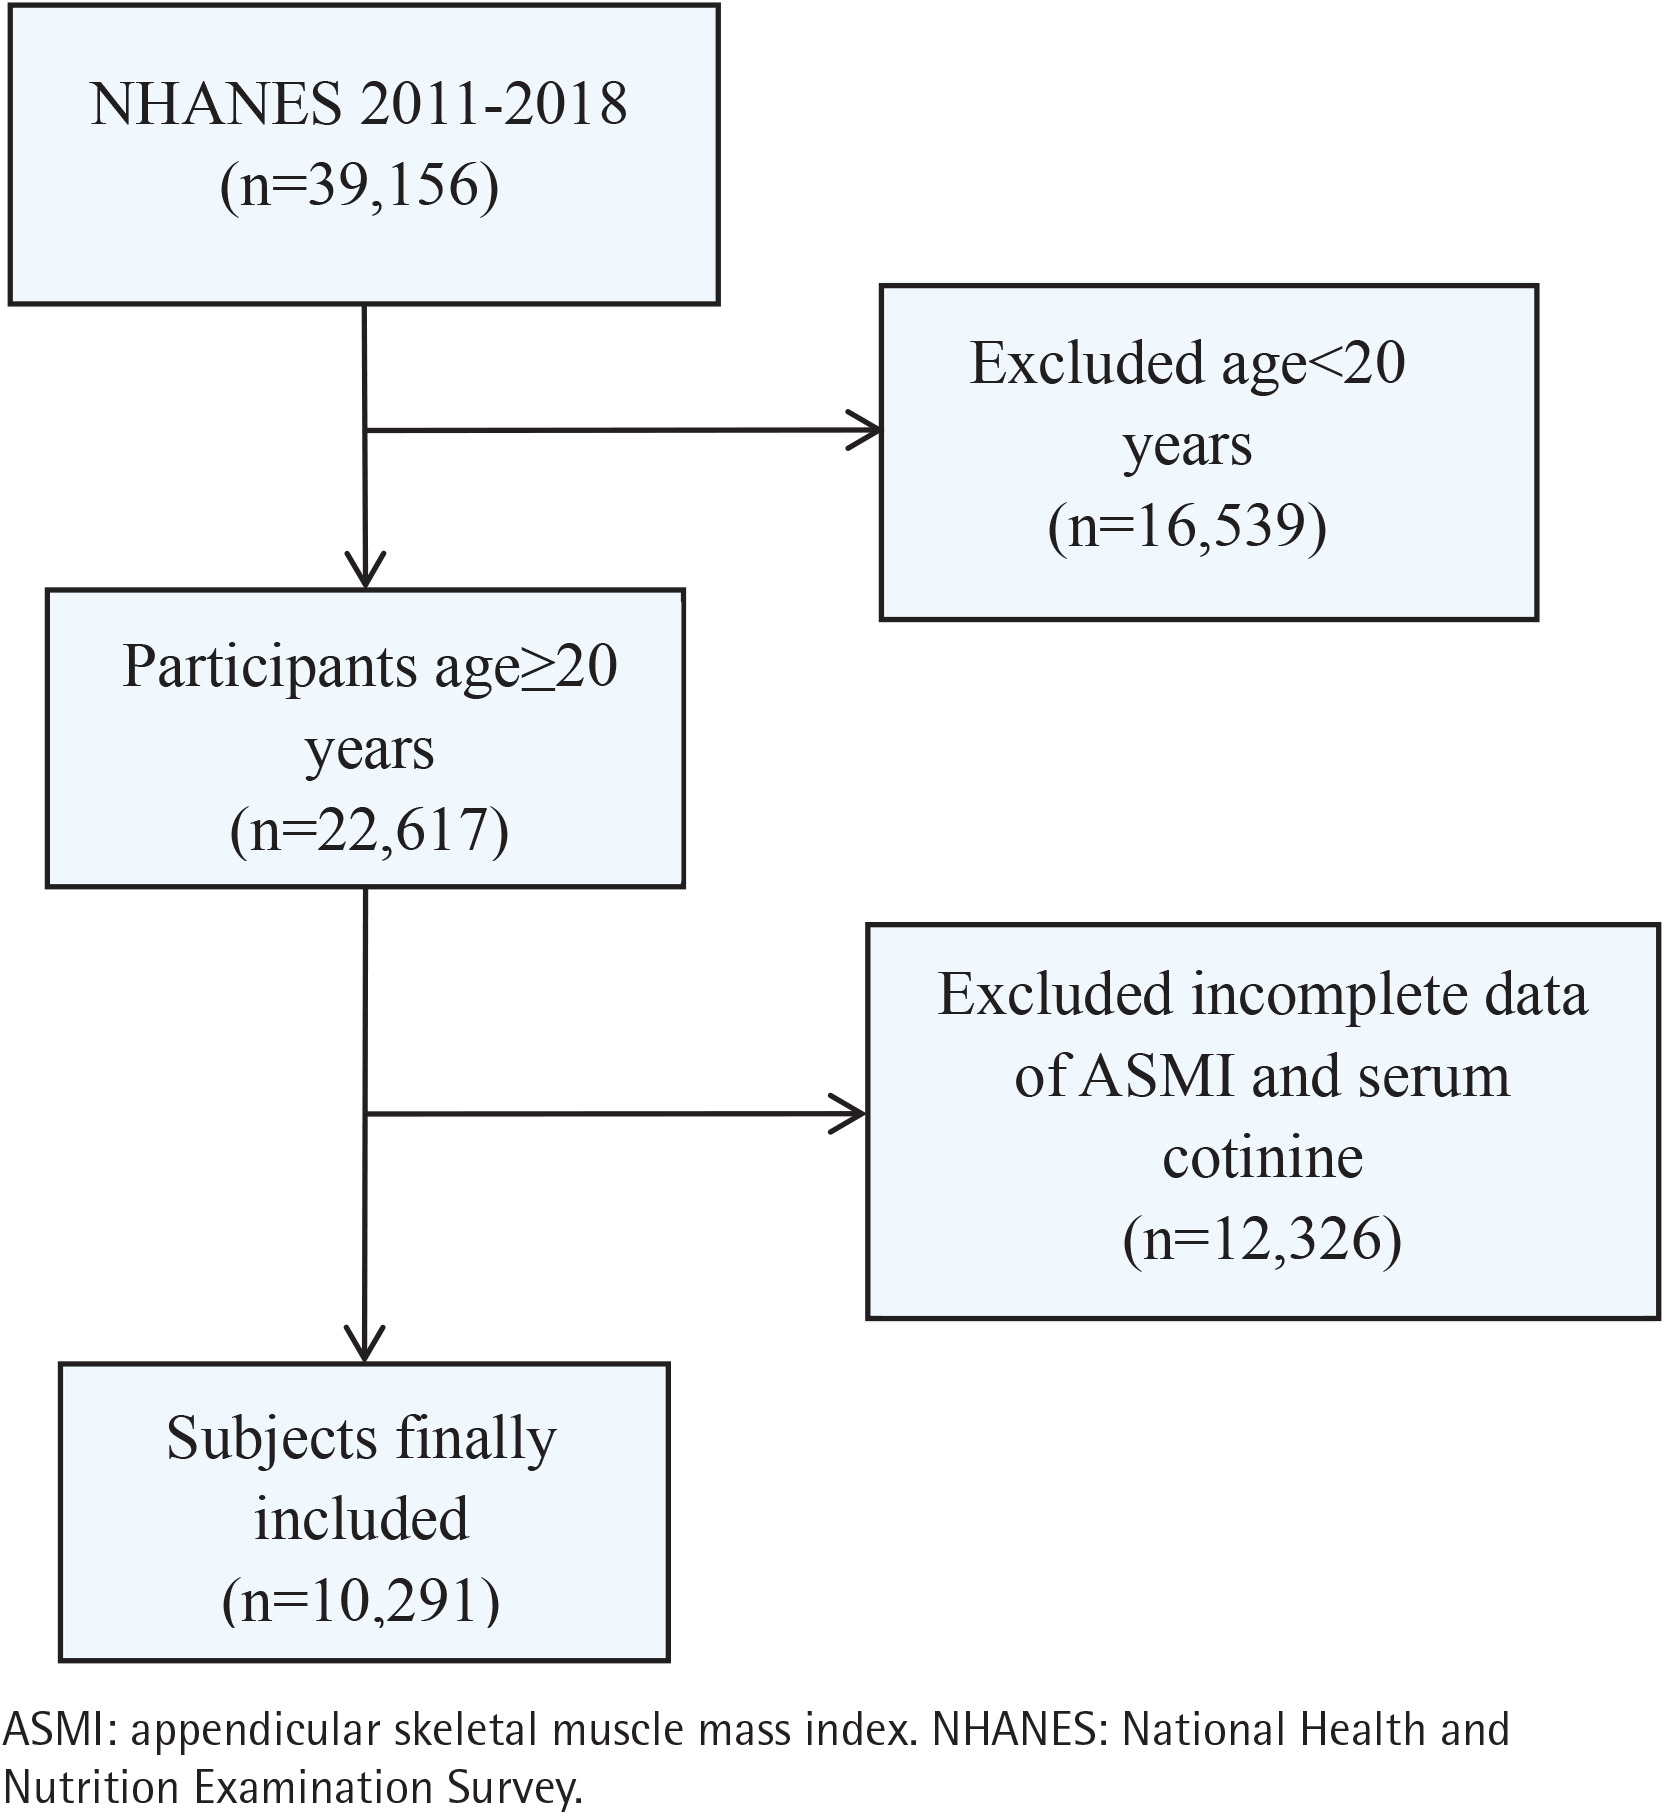
This study is a pooled secondary data analysis of cross-sectional data from the National Health and Nutrition Examination Survey (NHANES), conducted in the United States across four cycles (2011–2018). NHANES uses a complex, multistage probability sampling design to provide a nationally representative sample of the non-institutionalized US civilian population. The National Center for Health Statistics Research Ethics Review Board approved all protocols, and all participants provided written informed consent. Among the 39156 individuals initially enrolled, we excluded participants younger than 20 years (n=16539), individuals without appendicular skeletal muscle mass measurements (n=11869), and those missing data on serum cotinine (n=457). Consequently, the final analytic sample consisted of 10291 participants aged ≥20 years. The process of participant selection is illustrated in Figure 1.
Study variables
Muscle mass assessment
Appendicular skeletal muscle mass (ASM) was measured using dual-energy X-ray absorptiometry (DXA) as the sum of lean mass in the upper and lower extremities. The ASMI was calculated by dividing ASM by height squared (kg/m2). Sarcopenia was defined using standard gender-specific ASMI thresholds: <7.0 kg/m2 for males and <5.5 kg/m2 for females24,25.
Serum cotinine
Venous blood samples were collected at NHANES Mobile Examination Centers (MECs). Serum cotinine concentrations were measured using ID HPLC-APCI MS/MS.
Dietary inflammatory index and composite dietary antioxidant index
Dietary inflammatory potential was assessed using the DII. The DII was calculated based on 27 available dietary components, a validated approach comparable to the original 45-parameter model26. A DII score ≥0 indicates a pro-inflammatory diet, while a score <0 indicates an anti-inflammatory diet27. Dietary antioxidant capacity was evaluated using the CDAI28. The CDAI includes six antioxidants: selenium, zinc, carotenoids, and vitamins A, C, and E. The intake of each nutrient was standardized and summed to calculate the total CDAI score.
To examine the combined association of dietary inflammation and antioxidant intake, participants were categorized into three groups: 1) Pro-inflammatory and Pro-oxidative Diet (PIPOD): DII ≥0 and CDAI <0; 2) Mixed Inflammatory/Oxidative Diet (MIOD): DII <0 and CDAI <0, or DII ≥0 and CDAI >0; and 3) Anti-inflammatory and Anti-oxidative Diet (AIAOD): DII <0 and CDAI >0.
Covariates
We adjusted for potential confounders to evaluate the independent association between serum cotinine and skeletal muscle mass. Covariates included sociodemographic variables: age, gender(male, female), race (American, White, Black, other), marital status (married/living with a partner, widowed/ divorced/separated/never married), education level (lower than 12th grade/high school graduate or equivalent/some college or AA degree/college graduate or higher), poverty income ratio (PIR) and behavioral factors: smoking status (never, former and current), drinking status (never, former, mild, moderate, heavy), physical activity (yes, no). Physical activity (PA) was measured in metabolic equivalent (MET) minutes per week and categorized as meeting (≥600 MET-minutes/week) or not meeting adult activity guidelines16. Clinical variables included body mass index (BMI, kg/m2), hypertension (yes, no), diabetes mellitus (yes, no), and cardiovascular disease (CVD; yes, no). Biochemical covariates included total protein (g/dL), blood urea nitrogen (mg/dL), serum creatinine (mg/dL), serum creatinine (mg/dL), alkaline phosphatase (U/L), and serum phosphorus (mg/dL). Demographic and behavioral variables were self-reported via a standardized questionnaire, while biochemical markers were measured through laboratory tests.
Statistical analysis
Statistical analyses incorporated appropriate survey weights, strata, and primary sampling units according to Centers for Disease Control and Prevention (CDC) guidelines. Multi-year Mobile Examination Center (MEC) survey weights were calculated by dividing the 2-year weights by the number of combined cycles.
Baseline characteristics are presented as weighted means with standard errors (SE) for continuous variables, and as weighted frequencies and percentages (%) for categorical variables. Differences between groups were evaluated using design-adjusted Student’s t-tests or Rao-Scott chi-squared tests.
Survey-weighted generalized linear models were used to evaluate the association between serum cotinine and ASMI. Three models were constructed: Model 1 was unadjusted. Model 2 was adjusted for age, gender, and race. Model 3 was adjusted as for Model 2 plus marital status, education level, poverty-to-income ratio (PIR), smoking status, alcohol consumption, physical activity, hypertension, diabetes, cardiovascular disease, BMI, and all biochemical covariates. Serum cotinine was analyzed as both a continuous (log10-transformed) and categorical (tertiles) variable.
Restricted cubic spline (RCS) regressions with three knots (10th, 50th, and 90th percentiles) were used to explore non-linear dose-response associations between log10-transformed serum cotinine and ASMI.
Subgroup analyses were conducted across dietary categories (PIPOD, MIOD, AIAOD). Multiplicative interactions were tested by introducing cross-product terms between serum cotinine and dietary categories into the fully adjusted models.
Mediation analyses with 5000 bootstrap resamples (mediation package in R) were performed to estimate the mediating roles of DII and CDAI in the association between serum cotinine and ASMI. All statistical analyses were conducted using R version 4.1.3 (R Foundation for Statistical Computing, Vienna, Austria). Statistical significance was defined as a two-sided p<0.05.
RESULTS
Baseline characteristics of participants
Table 1 summarizes the baseline characteristics of the 10291 participants (weighted mean age, 39.39 ± 0.25 years; 50.18% male). Participants in the highest serum cotinine tertile were younger and more likely to be male compared to those in the lowest tertile. Higher cotinine levels were also associated with lower socioeconomic status, higher level of education, and a higher prevalence of frequent alcohol consumption. Nutritionally, individuals in the highest cotinine tertile exhibited more pro-inflammatory and fewer antioxidant-rich dietary patterns. Biochemically, this group demonstrated profiles indicative of greater oxidative stress and systemic inflammation (all p<0.05)
Table 1
Characteristics of the study participants according to serum cotinine tertile levels (ng/mL), United States, NHANES 2011–2018 (N=10291)
| Characteristics | Total n (%) | T1 n (%) | T2 n (%) | T3 n (%) | p* |
|---|---|---|---|---|---|
| Age (years), mean ± SE | 39.39 ± 0.25 | 41.10 ± 0.36 | 38.42 ± 0.38 | 38.33 ± 0.32 | <0.0001 |
| Gender | <0.0001 | ||||
| Female | 5228 (49.82) | 2027 (55.85) | 1824 (52.49) | 1377 (40.36) | |
| Male | 5063 (50.18) | 1414 (44.15) | 1597 (47.51) | 2052 (59.64) | |
| Race | <0.0001 | ||||
| Black | 2120 (10.99) | 396 (5.63) | 765 (12.97) | 959 (15.32) | |
| Mexican American | 1559 (10.65) | 750 (13.19) | 500 (11.51) | 309 (6.90) | |
| Other | 3030 (17.03) | 1149 (17.34) | 1180 (20.56) | 701 (13.35) | |
| White | 3582 (61.33) | 1146 (63.84) | 976 (54.97) | 1460 (64.42) | |
| Education level | <0.0001 | ||||
| Lower than 12th grade | 1877 (12.96) | 521 (8.77) | 550 (11.38) | 806 (19.28) | |
| High school graduate or equivalent | 2231 (21.53) | 507 (13.99) | 687 (20.60) | 1037 (31.11) | |
| Some college or AA degree | 3373 (33.21) | 1007 (28.94) | 1164 (36.05) | 1202 (35.46) | |
| College graduate or higher | 2810 (32.30) | 1406 (48.29) | 1020 (31.97) | 384 (14.15) | |
| Marital status | <0.0001 | ||||
| Divorced | 946 (9.29) | 261 (7.18) | 285 (8.57) | 400 (12.41) | |
| Living with partner | 1143 (10.58) | 246 (6.29) | 363 (11.15) | 534 (15.02) | |
| Married | 5028 (51.68) | 2146 (65.94) | 1683 (49.39) | 1199 (37.37) | |
| Never married | 2670 (24.54) | 661 (17.99) | 930 (27.22) | 1079 (29.59) | |
| Separated | 363 (2.74) | 84 (1.72) | 120 (2.64) | 159 (4.02) | |
| Widowed | 141 (1.15) | 43 (0.89) | 40 (1.02) | 58 (1.59) | |
| Smoking status | <0.0001 | ||||
| Never | 6267 (58.82) | 2859 (80.44) | 2689 (75.33) | 719 (18.33) | |
| Former | 1728 (19.60) | 563 (18.92) | 688 (23.21) | 477 (16.98) | |
| Current | 2296 (21.56) | 19 (0.59) | 44 (1.46) | 2233 (64.68) | |
| Drinking status | <0.0001 | ||||
| Never | 1065 (7.71) | 555 (8.97) | 281 (12.77) | 341 (10.84) | |
| Former | 2479 (27.28) | 500 (19.29) | 663 (21.92) | 1329 (43.65) | |
| Mild | 3387 (36.95) | 1204 (39.45) | 1359 (32.45) | 819 (24.27) | |
| Moderate | 1789 (18.82) | 606 (19.13) | 582 (20.22) | 789 (17.34) | |
| Heavy | 1571 (9.23) | 576 (13.17) | 536 (12.65) | 151 (3.91) | |
| Diabetes | 0.05 | ||||
| No | 1171 (8.91) | 413 (8.43) | 404 (9.52) | 354 (8.90) | |
| Yes | 9120 (91.09) | 3028 (91.58) | 3017 (90.47) | 3075 (91.10) | |
| Hypertension | <0.001 | ||||
| No | 7392 (72.93) | 2533 (74.47) | 2494 (74.64) | 2365 (69.53) | |
| Yes | 2899 (27.07) | 908 (25.53) | 927 (25.36) | 1064 (30.47) | |
| Cardiovascular diseases | <0.0001 | ||||
| No | 9897 (96.75) | 3353 (98.18) | 3318 (97.30) | 3226 (94.59) | |
| Yes | 394 (3.25) | 88 (1.82) | 103 (2.70) | 203 (5.41) | |
| Physical activity | 0.01 | ||||
| No | 2963 (28.32) | 1131 (22.22) | 1060 (20.76) | 942 (14.41) | |
| Yes | 7328 (71.68) | 2310 (77.78) | 2361 (79.24) | 2487 (85.59) | |
| Mean ± SE | Mean ± SE | Mean ± SE | Mean ± SE | ||
| PIR | 2.94 ± 0.05 | 3.45 ± 0.06 | 2.93 ± 0.05 | 2.38 ± 0.06 | <0.0001 |
| Clinical measurements | |||||
| BMI (kg/m²) | 28.68 ± 0.13 | 28.56 ± 0.17 | 29.17 ± 0.20 | 28.36 ± 0.15 | <0.001 |
| Alkaline phosphatase (U/L) | 67.08 ± 0.41 | 65.34 ± 0.55 | 66.74 ± 0.57 | 69.42 ± 0.61 | <0.0001 |
| Serum creatinine (mg/dL) | 0.85 ± 0.00 | 0.84 ± 0.01 | 0.85 ± 0.01 | 0.87 ± 0.01 | <0.001 |
| Total protein (g/dL) | 7.14 ± 0.01 | 7.14 ± 0.01 | 7.17 ± 0.01 | 7.11 ± 0.02 | <0.001 |
| Serum uric acid (mg/dL) | 5.31 ± 0.02 | 5.18 ± 0.03 | 5.36 ± 0.03 | 5.41 ± 0.04 | <0.0001 |
| Blood urea nitrogen (mg/dL) | 12.79 ± 0.08 | 13.37 ± 0.13 | 12.92 ± 0.10 | 12.02 ± 0.11 | <0.0001 |
| Serum phosphorus (mg/dL) | 3.72 ± 0.01 | 3.71 ± 0.01 | 3.72 ± 0.01 | 3.74 ± 0.01 | 0.41 |
| DII | 1.36 ± 0.04 | 1.12 ± 0.06 | 1.24 ± 0.06 | 1.74 ± 0.05 | <0.0001 |
| ASMI | 7.95 ± 0.03 | 7.80 ± 0.04 | 8.01 ± 0.04 | 8.06 ± 0.05 | <0.0001 |
| CDAI | 0.84 ± 0.07 | 1.22 ± 0.11 | 1.01 ± 0.12 | 0.24 ± 0.09 | <0.0001 |
Association between serum cotinine and ASMI
Table 2 presents the associations between serum cotinine and ASMI. In the fully adjusted model (Model 3), higher log10-transformed serum cotinine was significantly associated with decreased ASMI (β= -0.02; 95% CI: -0.03 – -0.01; p=0.02). Categorical analyses using cotinine tertiles yielded consistent results; compared to the lowest tertile (T1), participants in the highest tertile (T3) had significantly lower ASMI (β= -0.07; 95% CI: -0.11 – -0.02; p<0.01).
Table 2
Association between the serum cotinine and appendicular skeletal muscle mass index (ASMI), multivariable linear regression, United States, NHANES 2011–2018 (N=10291)
[i] Model 1 was unadjusted. Model 2 adjusted for gender, age, and race; Model 3 adjusted as for Model 2 plus marital status, education level, poverty income ratio, smoking status, drinking status, physical activity, hypertension, diabetes, cardiovascular diseases, body mass index, and biochemical markers (total protein, blood urea nitrogen, serum creatinine, serum calcium, alkaline phosphatase, and serum phosphorus). T1: cotinine level <0.018 ng/mL. T2: 0.018≤ cotinine level ≤0.492 ng/mL. T3: cotinine level >0.492 ng/mL. Analyses incorporated NHANES survey sampling weights to account for the complex survey design.
Mediation analyses
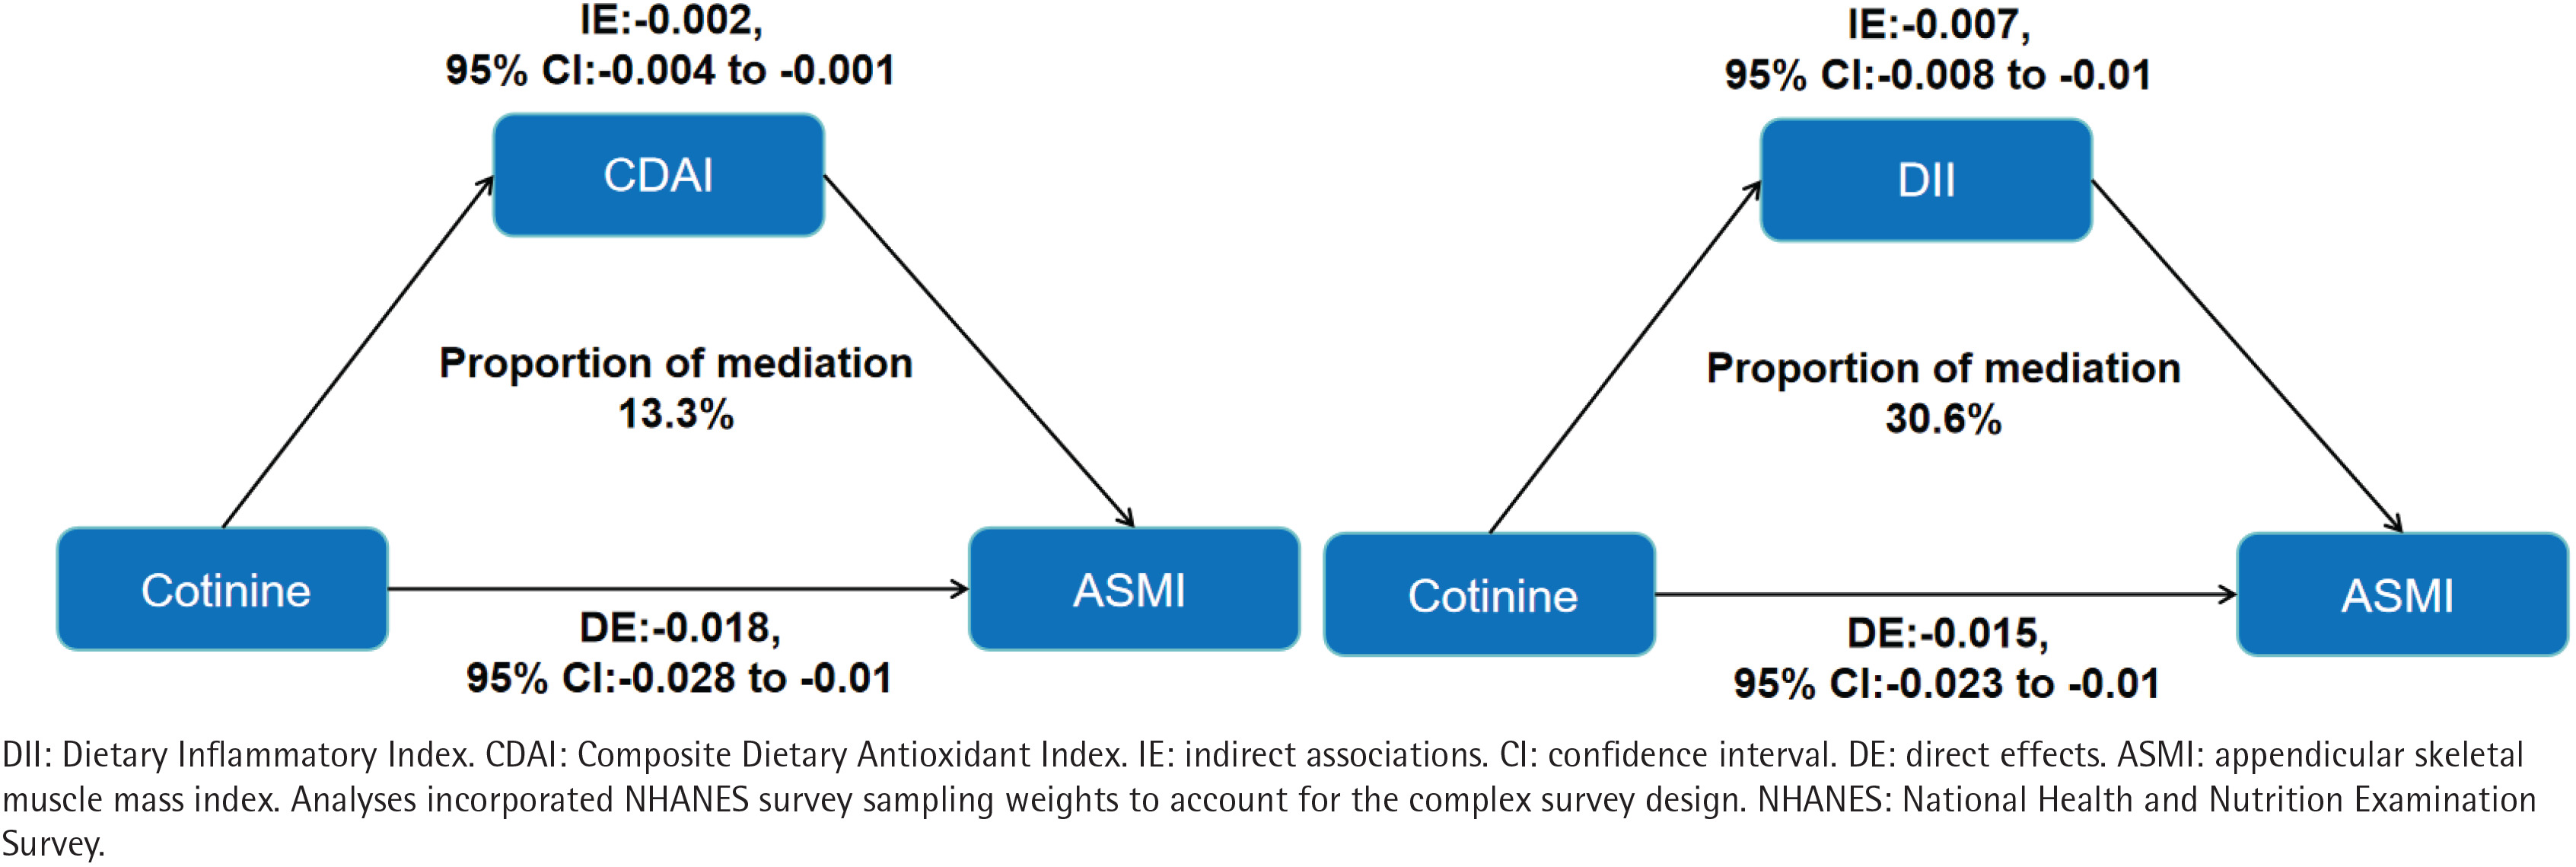
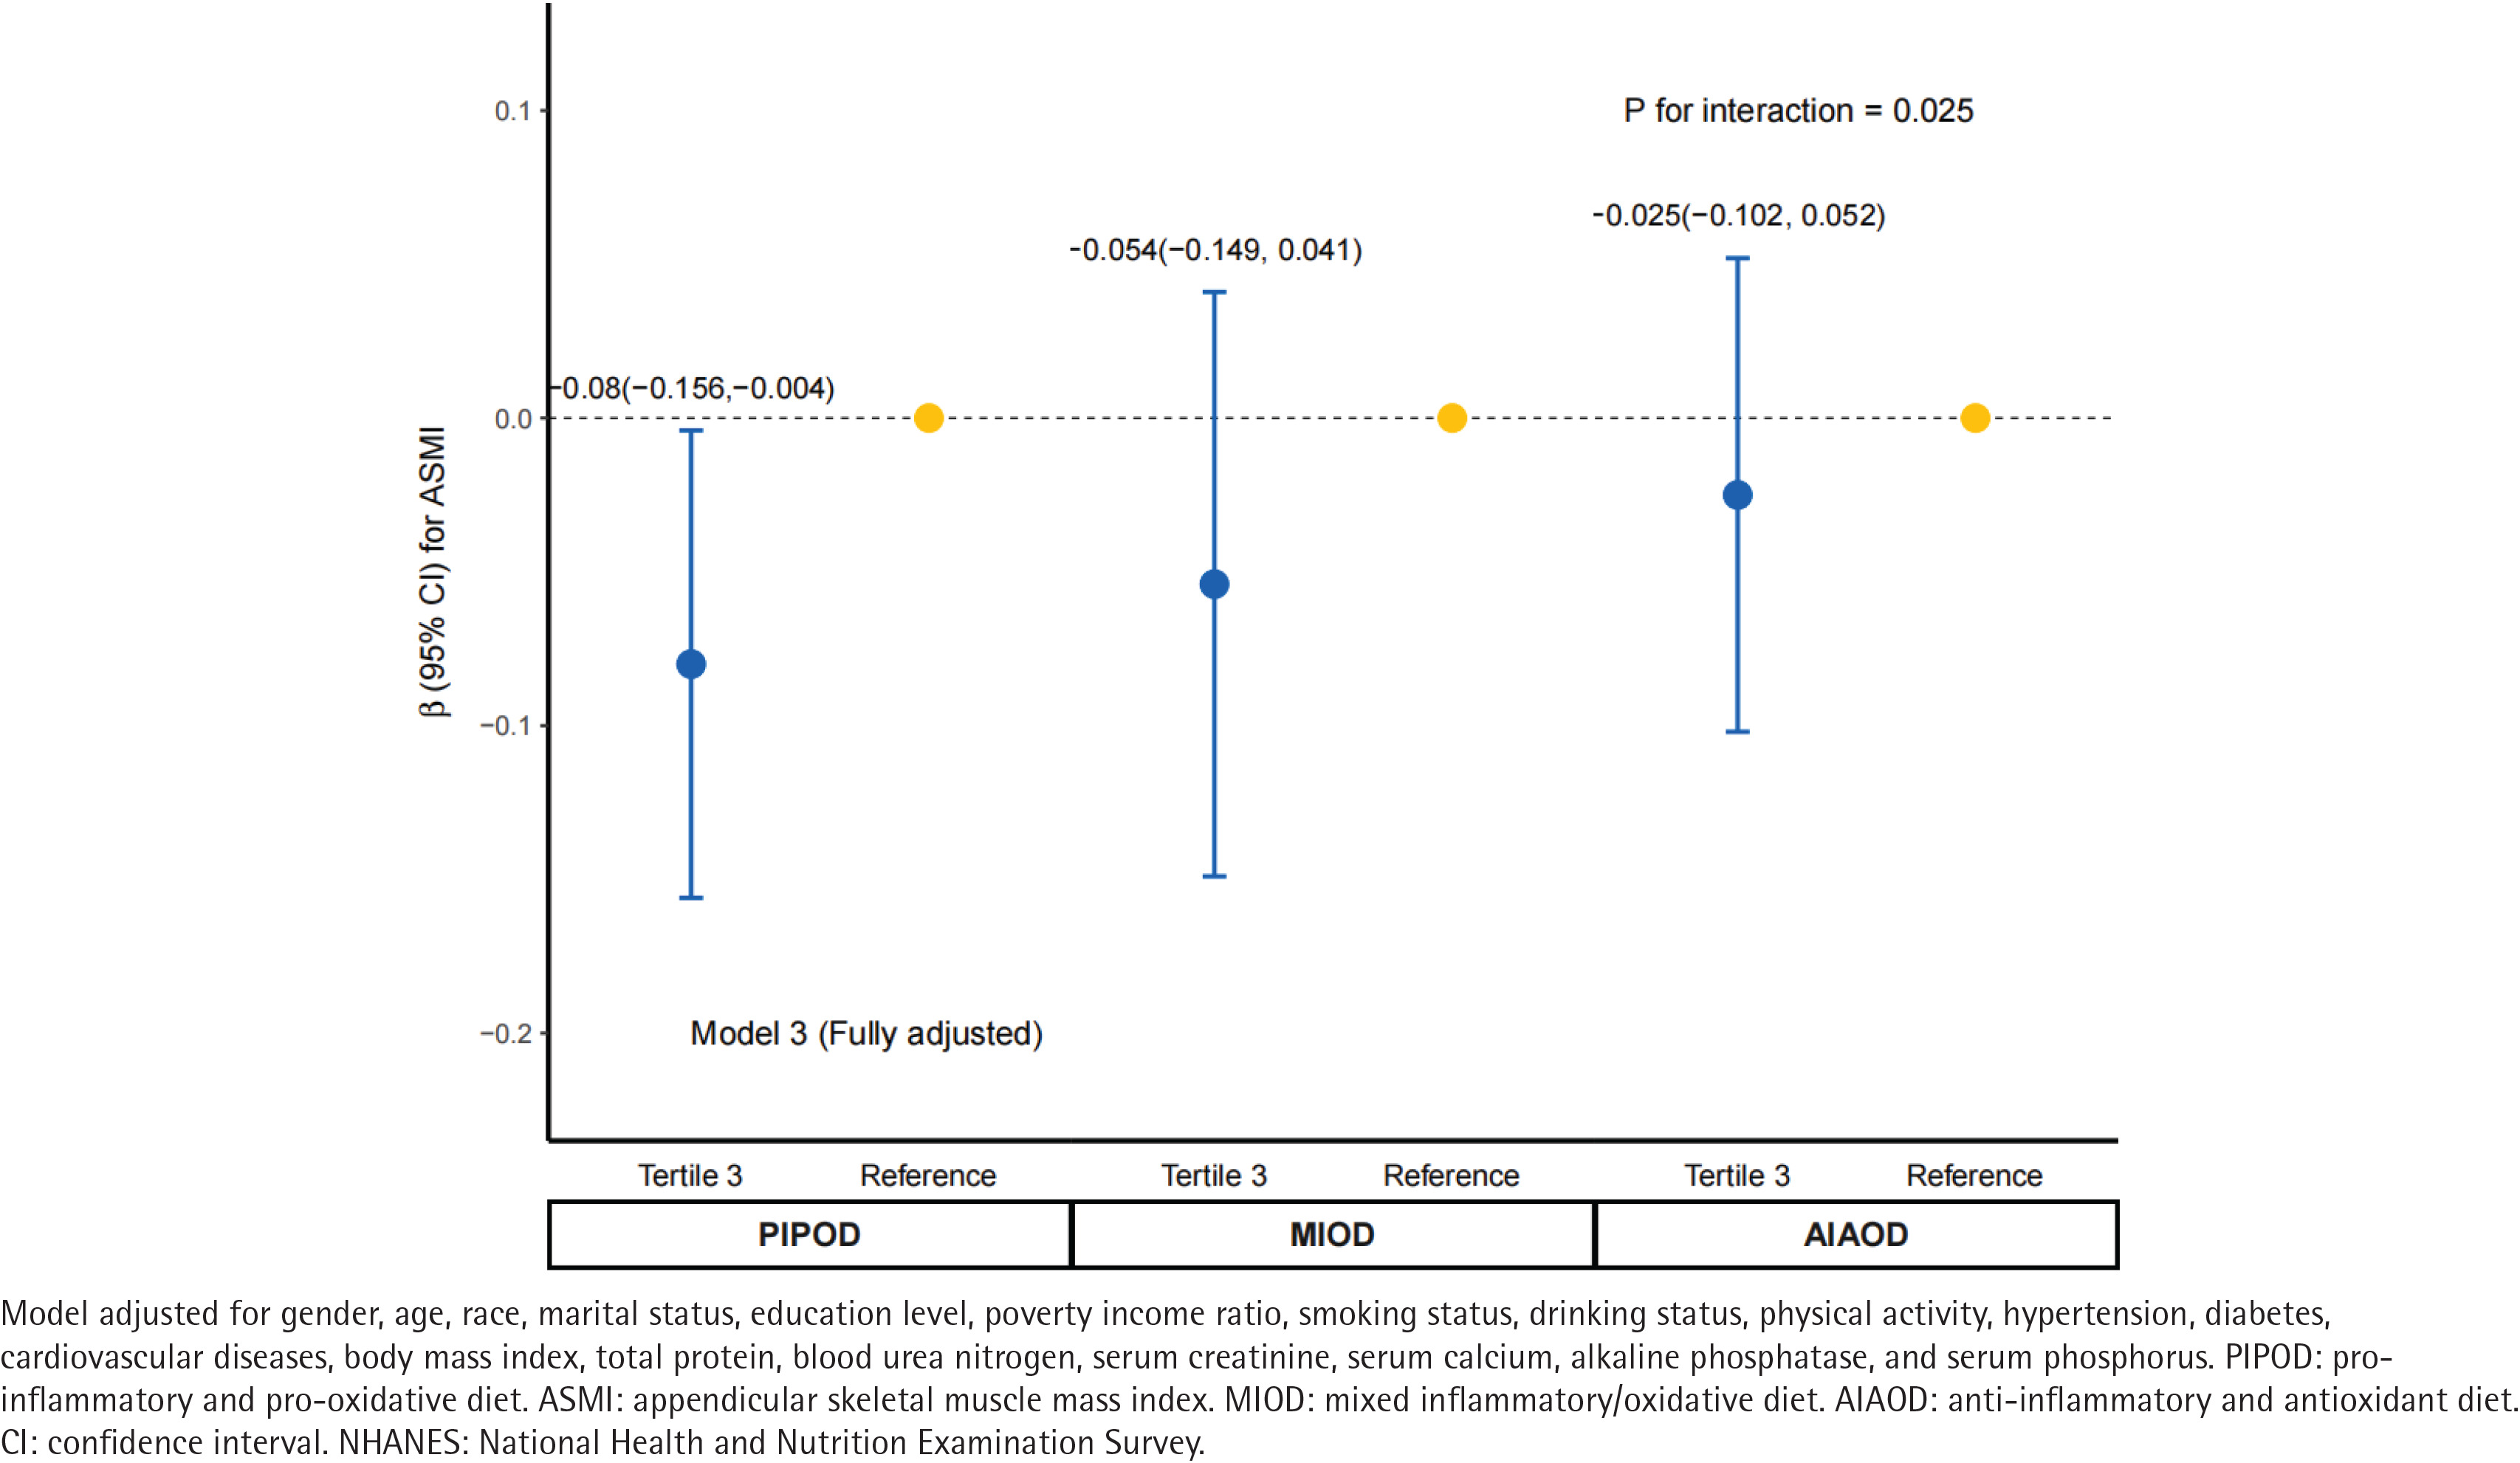
Parallel mediation analyses indicated that both CDAI and DII significantly mediated the association between serum cotinine and ASMI (Figure 2). The indirect effect via CDAI was -0.003 (95% CI: -0.004–0.000; p<0.001), accounting for 13.3% (95% CI: 7.8–23.0) of the total association. The indirect effect via DII was -0.007 (95% CI: -0.008 – -0.001; p<0.001), mediating a larger proportion (30.6%; 95% CI: 20.5–52.0) of the total association compared to CDAI. Furthermore, we examined the modifying influence of composite dietary profiles on this relationship. The inverse association remained significant among participants with a pro-inflammatory and pro-oxidative diet (β= -0.08; 95% CI: -0.156 – -0.004, p<0.001), whereas it was attenuated and no longer statistically significant among those with an anti-inflammatory and anti-oxidative diet (β= -0.025; 95% CI: -0.102–0.052, p>0.05). The interaction between serum cotinine and dietary profiles was statistically significant (p for interaction=0.025) (Figure 3).
Subgroup analyses
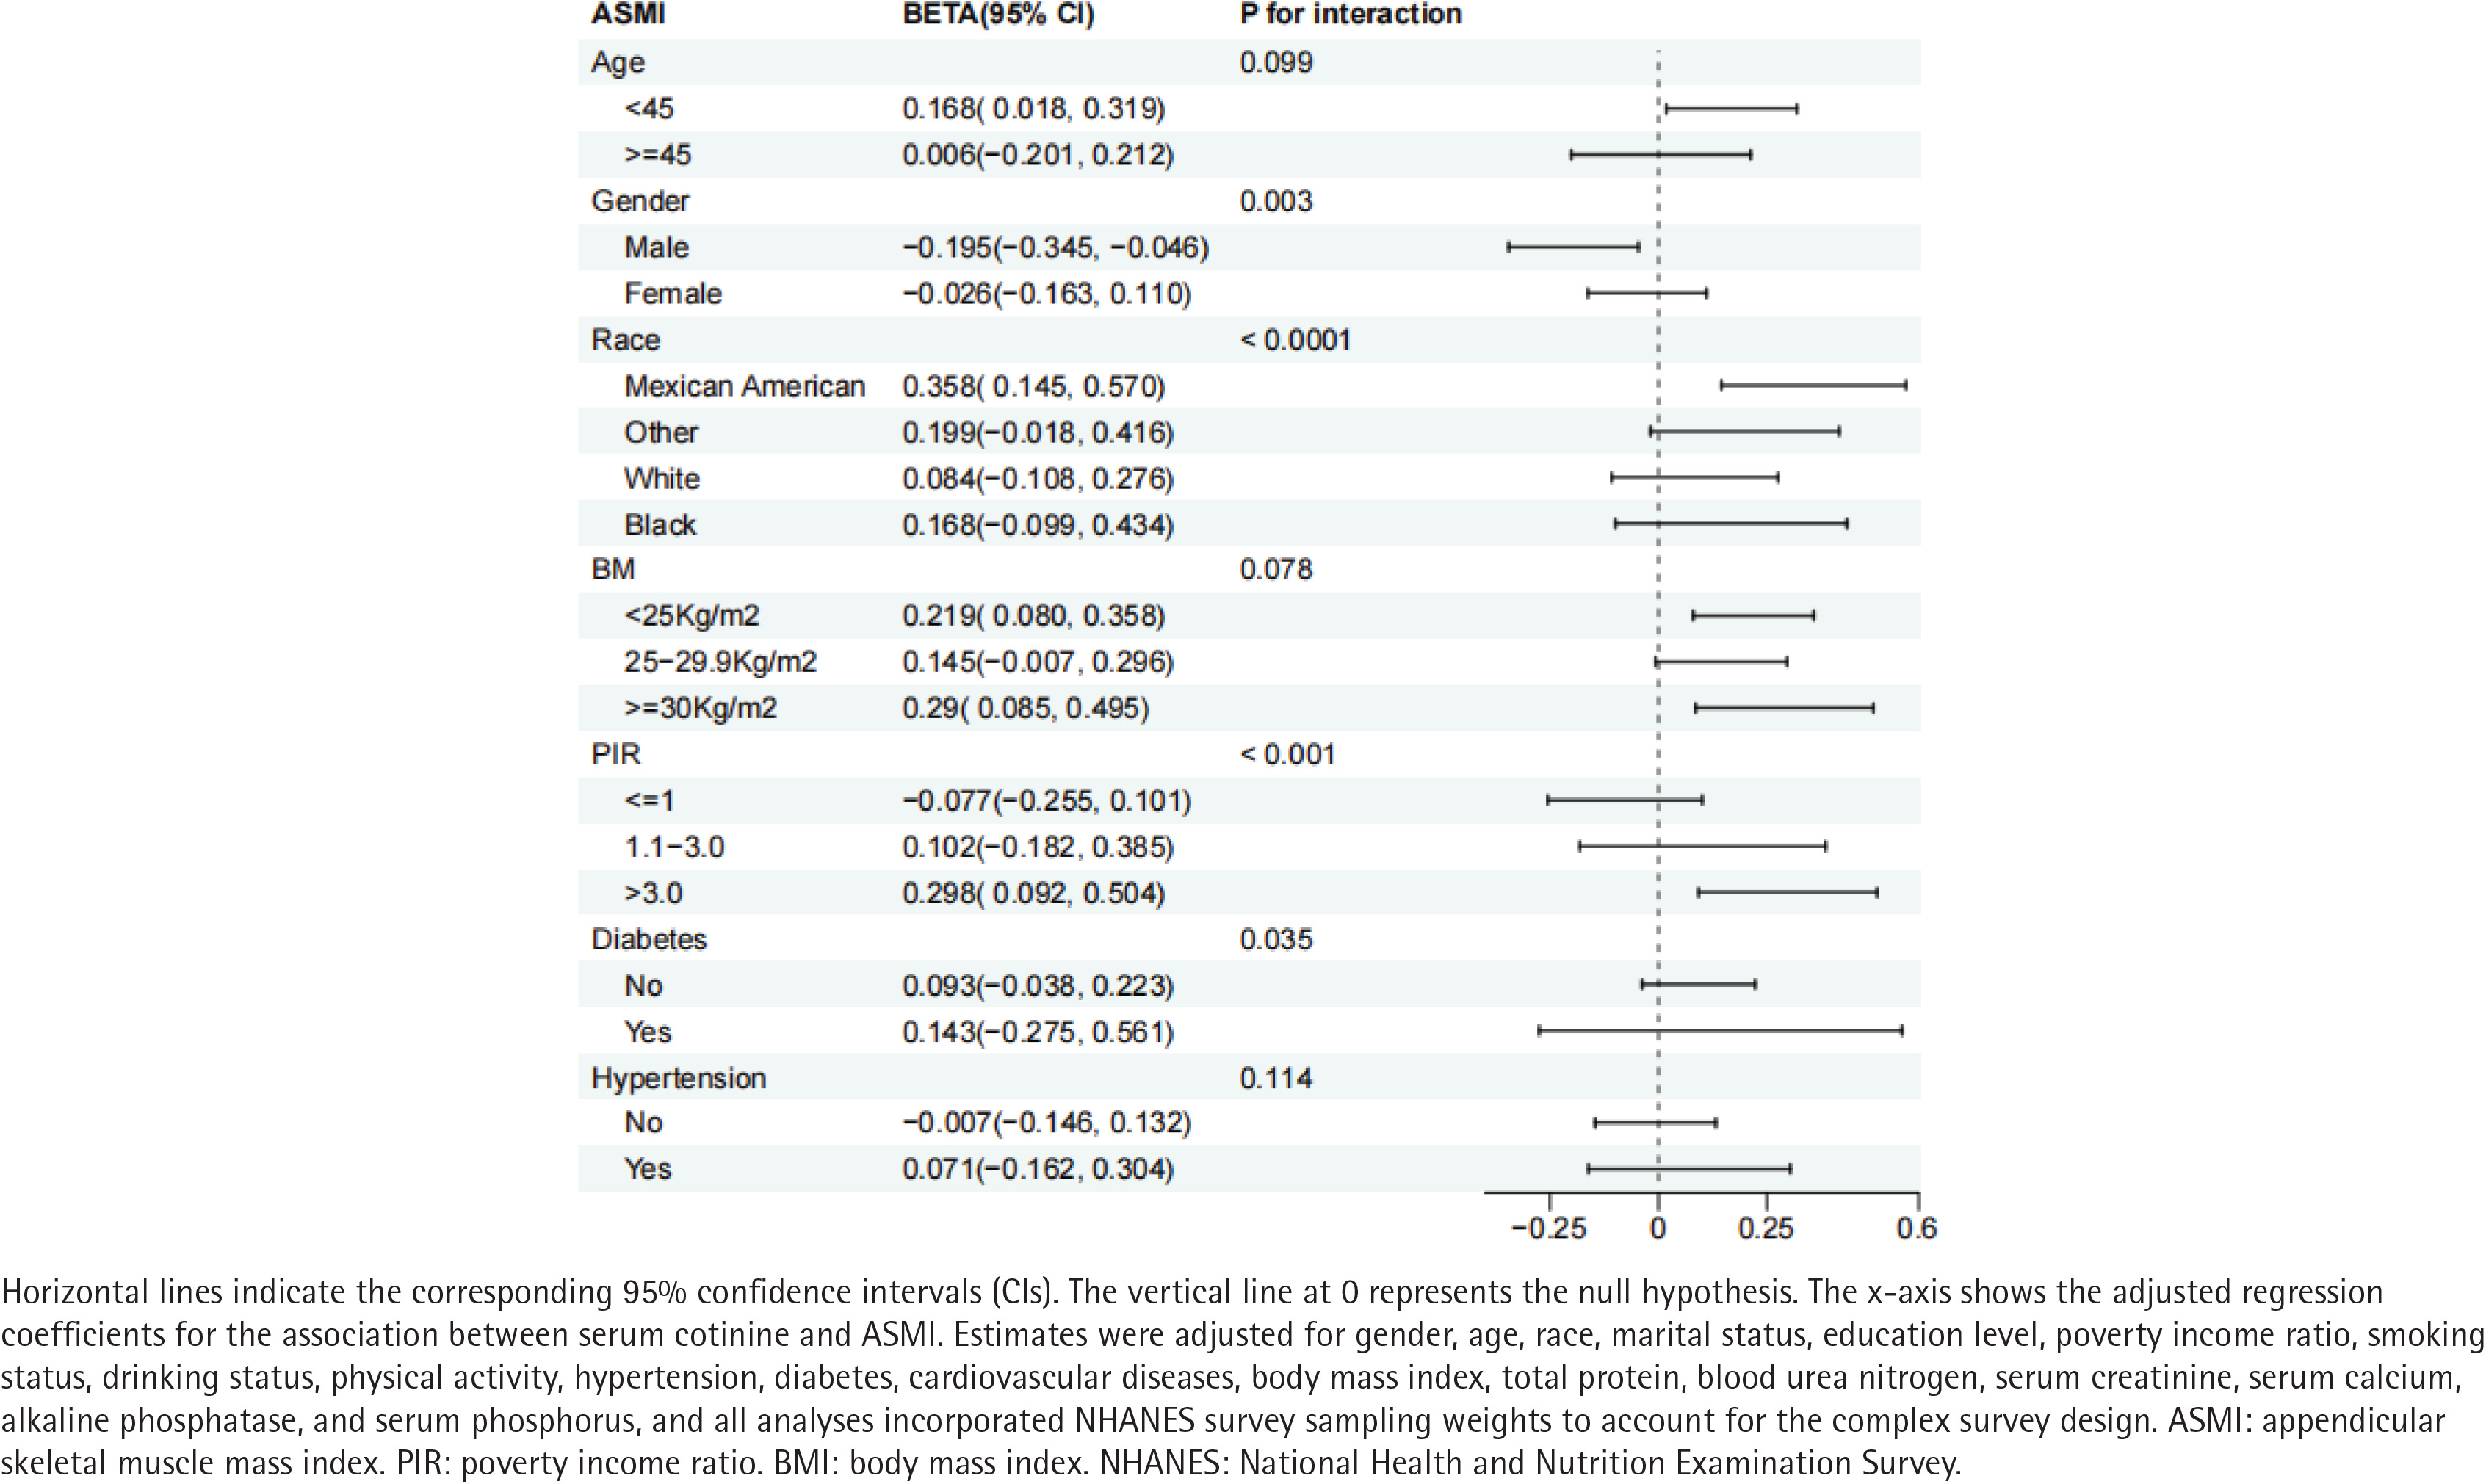
Stratified analyses identified significant interactions between serum cotinine and gender (p for interaction=0.003), race (p<0.001), PIR (p<0.001), and diabetes status (p=0.035). Specifically, the inverse association between serum cotinine and ASMI was more pronounced among males, Mexican Americans, individuals at both socioeconomic extremes, and those with diabetes (Figure 4).
Restricted cubic splines
Restricted cubic spline analysis revealed a significant non-linear association between log10-transformed serum cotinine and ASMI (p for non-linearity <0.05) (Supplementary file Figure 1). ASMI decreased with increasing cotinine concentrations up to an inflection point of approximately -1.0 (equivalent to 0.1 ng/ mL), beyond which it plateaued.
DISCUSSION
In this nationally representative cross-sectional study of US adults, higher serum cotinine was independently associated with decreased ASMI. Mediation analyses indicated that the DII and CDAI accounted for 30.6% and 13.3% of this association, respectively. Furthermore, this inverse association was pronounced among individuals with pro-inflammatory and pro-oxidative diets, but was no longer significant among those consuming anti-inflammatory and anti-oxidative diets.
Our findings indicate that dietary inflammatory and antioxidant profiles partially mediate the association between serum cotinine and ASMI. While previous observational studies link pro-inflammatory diets to reduced muscle mass29 and antioxidant-rich diets to favorable muscle outcomes23, we position these dietary indices as intermediate pathways in tobacco-associated muscle depletion.
Several biological mechanisms may explain the observed associations. First, cigarette smoke generates severe oxidative stress by depleting endogenous antioxidant reserves30 and inducing mitochondrial dysfunction, which reduces ATP availability and amplifies ROS production31. Second, this redox imbalance activates stress-sensitive signaling cascades (e.g. p38 MAPK and NF-κB) that upregulate the ubiquitin-proteasome system – specifically E3 ubiquitin ligases (MuRF1 and MAFbx) – driving uncompensated myofibrillar protein breakdown32,33. Finally, tobacco toxicants impair satellite cell function, blunting skeletal muscle regenerative capacity and recovery from injury or disuse33. Collectively, this dual burden of accelerated catabolism and impaired regeneration drives the progressive muscle depletion associated with systemic tobacco exposure.
Our findings suggest that nutritional quality significantly modulates the myocellular response to tobacco toxicants. Pro-inflammatory diets amplify tobacco-triggered systemic inflammation29. Conversely, dietary antioxidants scavenge ROS and chelate redox-active metals, limiting oxidative damage to myocellular proteins and lipids34. Additionally, micronutrients (e.g. zinc and selenium) serve as essential cofactors for endogenous antioxidant enzymes (e.g. superoxide dismutase and glutathione peroxidase), preserving mitochondrial efficiency35.
The attenuation of the cotinine–ASMI association among individuals with high dietary antioxidant intake suggests that optimal nutrition may buffer skeletal muscle against tobacco-related oxidative injury. This aligns with experimental data demonstrating that antioxidant supplementation reduces oxidative stress in tobacco-exposed populations, and with epidemiological evidence linking higher dietary antioxidant scores to reduced sarcopenia risk11.
Strengths and limitations
This study has several strengths. First, using serum cotinine – an objective biomarker – minimizes exposure misclassification compared to self-reported smoking status. Second, the complex, multistage probability design of NHANES, combined with appropriate survey weights, ensures the generalizability of our findings to the US adult population. Third, the simultaneous assessment of the DII and CDAI provides a more comprehensive evaluation of dietary quality than either index alone. Finally, our robust analytical framework – incorporating non-linear modeling, mediation, and stratified analyses – allows for an exploration of dose-response relationships, underlying pathways, and susceptible subpopulations.
Several limitations warrant consideration. First, our cross-sectional design precludes causal inference. Reverse causation remains possible; for instance, individuals with pre-existing low muscle mass might preferentially consume softer, highly processed (pro-inflammatory) foods. Second, despite rigorous covariate adjustment, residual confounding from unmeasured variables – such as specific resistance training protocols, genetic predispositions, or the ‘healthy user’ bias – cannot be completely excluded. Third, excluding participants with missing data may introduce selection bias. Furthermore, serum cotinine reflects only short-term tobacco exposure (preceding several days), potentially misclassifying intermittent smokers. Finally, our primary outcome was restricted to DXA-derived macroscopic muscle mass, lacking complementary assessments of muscle quality (e.g. myosteatosis) or physical function (e.g. grip strength) that could capture early functional decline.
CONCLUSIONS
In this nationally representative study, higher serum cotinine was independently associated with decreased ASMI. This inverse association was exacerbated by pro-inflammatory diets and attenuated by anti-inflammatory, antioxidant-rich dietary patterns, with DII and CDAI acting as partial mediators. These findings expand the understood scope of tobacco-related harm beyond the classical cardiopulmonary disease spectrum, highlighting skeletal muscle as a vulnerable target. While inherently hypothesis-generating, our results underscore the potential of targeted nutritional interventions to mitigate tobacco-associated muscle deterioration. Prospective cohort studies and randomized controlled trials are warranted to confirm causality and evaluate the clinical efficacy of these dietary strategies.