
INTRODUCTION
Chronic obstructive pulmonary disease (COPD) poses a significant global health challenge due to its elevated prevalence1. In 2017, it was estimated that 544.9 million individuals were affected by chronic respiratory conditions, with approximately 55% of these cases linked to COPD2. The World Health Organization (WHO) anticipates that by 2030, COPD will rank as the third leading cause of mortality globally3. In 2008, COPD was known as the fourth and third leading cause of death in urban and rural areas in China, respectively4. Zhong et al.5 conducted a survey involving 20245 adults across seven regions in China, revealing that the prevalence of COPD in individuals aged ≥40 years reached as high as 8.20%. Thus, the China Pulmonary Health study (2012–2015) spearheaded by Wang et al.6 indicated that the prevalence of COPD in Chinese adults aged ≥20 years was 8.60%, with the prevalence in those aged ≥40 years soaring to 13.70%. The estimated patient population in China approaches 100 million, roughly one-third of the global total, indicating that COPD incidence in China continues to rise6. However, the anticipated rise in COPD incidence is not surprising. Because some people with abnormal lung function trajectories but not yet meeting the diagnostic criteria may be overlooked. Although this group of people may not have obvious respiratory symptoms at present, they have a relatively high risk of developing COPD in the future. Thus, a substantial segment of the population exists in a Pre-COPD state7. As yet, there is no worldwide agreement on how to define early COPD. Pre-COPD simply describes people who have no chronic respiratory symptoms and structural but functional lung changes, whose post-bronchodilator FEV1/FVC is still ≥0.7 and FEV1<80%, who are at high risk of developing COPD later7,8.
The Global Initiative for Chronic Obstructive Lung Disease 2023 Report highlighted that COPD is a prevalent, preventable, and treatable condition, but significant underdiagnosis and diagnostic delay result in patients receiving either no treatment or inappropriate treatment9. To alleviate the burden of COPD, enhanced therapeutic strategies and targeted public-health interventions – together with individualized exposure-reduction measures – will be required10. Cigarette smoking is the single most important aetiologic factor in the development and progression of COPD: approximately 80–90% of affected individuals have a significant smoking history, and the lifetime risk of airflow limitation in persistent smokers is 3- to 5-fold higher than in never smokers11. It is crucial to acknowledge that environmental factors beyond tobacco smoking may also contribute to COPD and Pre-COPD. Although the hazards of the early stage of COPD are clear, there is still a lack of certainty regarding the definition and standards of ‘early COPD’, and whether intervention for patients with Pre-COPD can bring about long-term benefits. Currently, population-based data on Pre-COPD remain scarce. To address this issue, we conducted a large-scale cross-sectional survey in Guizhou Province, China.
METHODS
Study design and participants
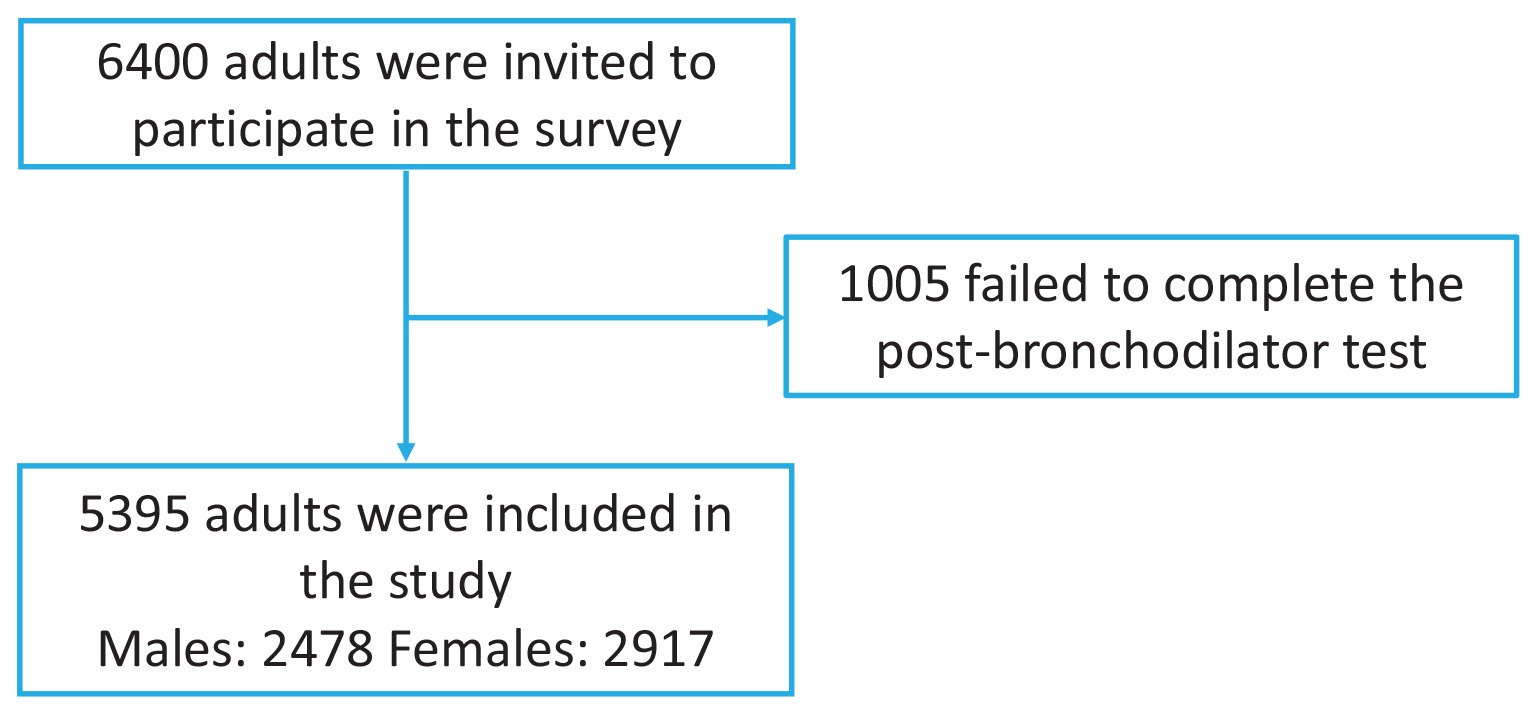
The study was conducted from June 2012 to May 2015. We employed simple random sampling to select participants from the research area. In Guizhou Province, we evaluated 6400 individuals. Of these, 5395 adults aged ≥20 years who had resided at their current address for a minimum of six months prior to the survey, were invited to take part (Figure 1). We excluded people who could not be interviewed or who declined to give informed consent. Additionally, we excluded individuals that were ineligible for spirometry due to various conditions: 1) chest, abdominal, or eye surgery; 2) retinal detachment; 3) a myocardial infarction within the last three months; 4) hospitalization for cardiac issues in the preceding month; and 5) pregnancy or breastfeeding. This study protocol received approval from the Ethics Review Committee of Guizhou Provincial People’s Hospital. We obtained written informed consent from all participants.
The present study was designed as a retrospective cohort analysis. Therefore, the sample size was not determined by a formal a priori power calculation. Instead, it was defined by the total number of individuals who met the predefined inclusion and exclusion criteria within the specified study period. All eligible participants available in the database during this period were included in the analysis to minimize selection bias and to ensure the study sample accurately reflects the real-world population.
Procedures
Researchers attended two days of training before administering a questionnaire on demographics, COPD-related factors, medical history, and parental respiratory history. Regarding our definitions, current smokers were those who had smoked at least 100 cigarettes in their lifetime and still smoked. Passive smokers were individuals who reported inhaling other people’s smoke. Smoking during pregnancy was recorded if a mother had a history of smoking or passive smoking during pregnancy. The use of domestic fuels such as biofuels, coal, and gas was considered if it lasted longer than six months. Samples were grouped into smoke exposure (coal, biofuel) and non-exposure (electricity, gas) categories. Trained personnel assessed indoor environments for ventilation quality and kitchen/bedroom layouts. Biomass use included woody fuels or animal waste for cooking within the past six months. After the questionnaire, trained researchers conducted pulmonary function tests using a spirometer, measuring FVC and FEV1 before and after administering a bronchodilator. COPD was defined as post-bronchodilator FEV1/FVC<70%, and Pre-COPD was defined as FEV1/FVC ≥70% and FEV1 <80%, following GOLD guidelines7. An expert panel supervised quality control by excluding poor-quality tests.
Statistical methods
Statistical analyses were performed using IBM SPSS Statistics (version 23.00) and R. Comparisons of continuous variables were performed using Welch’s two-sample t-test (unequal variances). Comparisons of categorical variables used the Pearson chi-squared test without continuity correction. For binomial proportion estimates, 95% confidence intervals were calculated using the Wilson method, given its superior performance for proportions. For sample means, 95% confidence intervals were computed using t-distribution-based intervals. Multiple comparisons were adjusted using the Benjamini–Hochberg false discovery rate (FDR) procedure. To ensure proper control of Type I error, FDR correction was applied across the entire set of comparisons. A p<0.05 was considered statistically significant. All hypothesis tests in the study were two-sided.
RESULTS
Demographic characteristics
Study participants varied by sex, age group, city or country, education level, ethnicity, occupation, body mass index, smoking history, biofuel exposure, kitchen room separation, and medical history. Overall, data from 5395 participants were included and are shown in Figure 1. There were 2478 males and 2917 females, aged 20–86 years, with an average age of 45.9 ± 13.95 years. Urban residents (4221 participants) made up 78.24% (95% CI: 77.11–79.32, Wilson method unless otherwise stated), with the remaining living in rural areas. Most participants were of Han ethnicity, with 4926 people, representing 91.31% (95% CI: 90.53–92.03); however, 469 individuals belonged to various ethnic minorities, accounting for 8.69% (95% CI: 7.97–9.47). Remarkably, 1348 people had only completed primary school, making up 24.99% (95% CI: 23.85–26.16). A total of 1777 people had completed junior high school (mean: 32.94%; 95% CI: 31.70–34.20), and 1314 had a senior high school education (mean: 24.36%; 95% CI: 23.23–25.52). Only 956 participants had attained university education or higher, accounting for 17.7% (95% CI: 16.72–18.76) of the sample. The majority of tobacco users smoked products such as cigarettes and chillums (a straight conical pipe with an end-to-end channel used for smoking). We examined 3671 people who had never smoked, representing 68.04% (95% CI: 66.79–69.28) of the sample. Others had a history of smoking, including 1546 current smokers (28.66%; 95% CI: 27.47–29.85) and 178 people who had quit smoking (3.30%; 95% CI: 2.85–3.81). Our study found that 96.1% (95% CI: 95.56–96.59) of the population had not been exposed to biofuels, such as coal, LP, gas, and grass, used for at least six months. Exposure to indoor smoke from burning biomass was 3.24% (firewood 3.26%, manure 0.06%, and coal 28.67% for more than half a year). Frying and roasting accounted for 67.04%. A total of 338 people did not have a separate kitchen from the bedroom, representing 6.27% (95% CI: 5.65–6.94) of the sample. COPD patients had a related medical history, with 216 having a history of chronic bronchitis, accounting for 4.00% (95% CI: 3.51–4.56) of all COPD cases (Table 1).
Table 1
Baseline demographic and exposure characteristics of adults, aged ≥20 years, in the Guizhou Province COPD Study, 2012–2015 (N=5395)
Factors associated with COPD and Pre-COPD
Overall, 518 participants aged ≥20 years were diagnosed with COPD, with a prevalence of 9.60% (95% CI: 8.84–10.42, p<0.0005). Of these COPD patients, 5.17% (95% CI: 4.61–5.79) were men, and 4.40% (95% CI: 3.91–5.01) were women. The age-standardized prevalence rates of COPD across disease stages were 45.95% (95% CI: 41.70–50.25) for stage I, 45.60% (95% CI: 41.32–49.87) for stage II, 7.52% (95% CI: 5.56–10.13) for stage III, and 0.97% (95% CI: 0.41–2.24) for stage IV (Table 2). Additionally, 1264 participants were considered to have Pre-COPD, accounting for 23.43% (95% CI: 22.32–24.58) of the total subjects. When grouped by age category, according to PFT results, 518 individuals were considered to have COPD: 89, aged 20–40; 225, aged 40–60 years, and 204, ≥61 years. The prevalence of COPD increased with age in our study. The smoking rate of the investigated population was 31.96% (95% CI: 30.72–33.21), but that of COPD patients was 38.90%. The prevalence of COPD was significantly different between smokers and non-smokers (p<0.0001). However, there were 33 COPD patients whose mothers smoked during pregnancy and 217 whose mothers were passive smokers. Other risk factors, such as frequent frying, stir-fry, roasting, and cooking, were associated with COPD (p<00009). When the subjects were divided into groups according to education level, there was a significant difference (p<0.002), and the result indicated that the prevalence of COPD decreased with increasing education level. However, the prevalence of some COPD patients with an underlying history, such as asthma, chronic bronchitis, emphysema-COPD, pulmonary heart disease, bronchiectasis, tuberculosis and lung cancer, were not significantly different from those with COPD, perhaps due to the small sample size. Similarly, mood/state of mind and the results of the Gastroesophageal Reflux Disease Questionnaire (GERD-Q) were not significantly different between patients with COPD and those without. Red blood cell (RBC) counts, hemoglobin (HGB) levels, platelet (PLT) counts, and fibrinogen (FBG) levels in the peripheral blood were associated with COPD status, and the results revealed that RBC (p<0.001), HGB (p<0.001), PLT (p<0.02) and FBG (p<0.02) levels were also related to COPD (Table 3).
Table 2
Prevalence and GOLD grade distribution of COPD among adults, aged ≥20 years, in the Guizhou Province survey
| n | % | |
|---|---|---|
| COPD | ||
| Yes | 518 | 9.60 |
| No | 4877 | 90.40 |
| GOLD of COPD | ||
| Grade 1 | 238 | 45.90 |
| Grade 2 | 236 | 45.60 |
| Grade 3 | 39 | 7.50 |
| Grade 4 | 5 | 0.90 |
Table 3
Factors associated with COPD and Pre-COPD in adults, aged ≥20 years, Guizhou Province, 2012–2015 (N=5395)
| Factors | COPD (N=518) n (%) | p a | Non-COPD (N=4877) n (%) | p b | p c | ||||
|---|---|---|---|---|---|---|---|---|---|
| Men 279 (5.17) | Women 239 (4.43) | Total 518 (9.60) | 0.0005 | Men 2199 (40.76) | Women 2678 (49.64) | Total 4877 (90.40) | 0.39 | ||
| Age (years) | |||||||||
| 20–40 | 37 (41.57) | 52 (58.43) | 89 | 0.41 | 1035 (53.00) | 918 (47.00) | 1953 | <0.0001 | <0.0001 |
| 41–60 | 136 (60.44) | 89 (39.56) | 225 | <0.0001 | 904 (40.65) | 1320 (59.35) | 2224 | <0.0001 | 0.39 |
| ≥61 | 106 (51.96) | 98 (48.39) | 204 | 0.09 | 245 (37.98) | 400 (62.02) | 645 | 0.0001 | <0.0001 |
| Education level | |||||||||
| Primary school or lower | 97 (45.75) | 115 (54.25) | 212 | 0.96 | 323 (28.43) | 813 (71.57%) | 1136 | <0.0001 | <0.0001 |
| Junior/senior high school or technical secondary school | 150 (58.82) | 105 (41.18) | 255 | <0.0001 | 1326 (46.76) | 1510 (53.24) | 2836 | 0.48 | 0.0004 |
| University/ junior college or research | 32 (62.75) | 19 (37.25) | 51 | 0.02 | 550 (60.77) | 355 (39.23) | 905 | <0.0001 | <0.0001 |
| Body mass index (kg/m2) | |||||||||
| <18.5 (underweight) | 19 (55.88) | 15 (44.12) | 34 | 0.25 | 130 (48.69) | 137 (51.31) | 267 | 0.38 | 0.35 |
| 18.5–23.9 (normal weight) | 142 (48.97) | 148 (51.03) | 290 | 0.31 | 1145 (43.05) | 1515 (56.95) | 2660 | 0.01 | 0.57 |
| ≥24.0 (overweight) | 114 (60.32) | 75 (39.68) | 189 | <0.0001 | 903 (47.15) | 1012 (52.85) | 1915 | 0.36 | 0.26 |
| Smoking status | |||||||||
| Never smoker | 66 (23.07) | 220 (76.93) | 286 | <0.0001 | 807 (23.84) | 2578 (76.16) | 3385 | <0.0001 | <0.0001 |
| Current smoker | 186 (92.07) | 16 (7.93) | 202 | <0.0001 | 1255 (93.37) | 89 (6.63) | 1344 | <0.0001 | <0.0001 |
| Quit | 27 (90.00) | 3 (10.00) | 30 | <0.0001 | 137 (92.57) | 11 (7.43) | 148 | <0.0001 | 0.003 |
| Mother smoked in pregnancy | 23 (69.70) | 10 (30.30) | 33 | 0.0063 | 83 (43.01) | 110 (56.99) | 193 | 0.42 | 0.02 |
| Mother exposed to SHS in pregnancy | 120 (55.30) | 97 (44.70) | 217 | 0.0067 | 924 (47.36) | 1027 (52.64) | 1951 | 0.28 | 0.45 |
| Biofuel exposure | |||||||||
| Yes | 5 (33.33) | 10 (66.67) | 15 | 0.33 | 78 (48.75) | 82 (51.25) | 160 | 0.48 | 0.67 |
| Fry/stir-fry/roast | 192 (55.01) | 157 (45.99) | 349 | 0.0009 | 1524 (46.63) | 1744 (53.37) | 3268 | 0.52 | 0.88 |
| Coal >6 months | 97 (48.50) | 103 (51.50) | 200 | 0.47 | 568 (42.17) | 779 (57.83) | 1347 | 0.01 | <0.0001 |
| LPG >6 months | 53 (53.00) | 47 (47.00) | 100 | 0.16 | 433 (43.91) | 553 (56.09) | 986 | 0.24 | 0.65 |
| Gas >6 months | 38 (53.52) | 33 (46.48) | 71 | 0.20 | 484 (51.88) | 449 (48.12) | 933 | 0.0008 | 0.01 |
| Grass >6 months | 5 (33.33) | 10 (66.67) | 15 | 0.33 | 80 (49.69) | 81 (50.31) | 161 | 0.35 | 0.65 |
| Kitchen separate | |||||||||
| Yes | 259 (54.64) | 215 (45.36) | 474 | 0.0002 | 2050 (45.05) | 2500 (54.95) | 4550 | 0.38 | 0.17 |
| No | 19 (43.18) | 25 (56.82) | 44 | 0.72 | 149 (45.57) | 178 (54.43) | 327 | 0.90 | 0.17 |
| Medical history | |||||||||
| Asthma | 6 (50.00) | 6 (50.00) | 12 | 0.78 | 35 (45.45) | 42 (54.55) | 77 | 0.93 | 0.26 |
| Chronic bronchitis | 8 (42.11) | 11 (57.89) | 19 | 0.74 | 86 (43.65) | 111 (56.35) | 197 | 0.53 | 0.71 |
| Emphysema COPD | 4 (36.36) | 7 (63.64) | 11 | 0.52 | 34 (36.96) | 58 (63.04) | 92 | 0.09 | 0.73 |
| Pulmonary heart disease | 4 (66.67) | 2 (33.33) | 6 | 0.31 | 15 (45.45) | 18 (54.55) | 33 | 0.96 | 0.28 |
| Bronchiectasis | 1 (50.00) | 1 (50.00) | 2 | 0.91 | 3 (50.00) | 3 (50.00) | 6 | 0.84 | 0.21 |
| Lung TB | 7 (77.78) | 2 (22.22) | 9 | 0.06 | 29 (50.88) | 28 (49.12) | 57 | 0.54 | 0.32 |
| Lung CA | 3 (75.00) | 1 (25.00) | 4 | 0.24 | 26 (42.62) | 35 (57.38) | 61 | 0.61 | 0.38 |
| Mood/state of mind, mean (95% CI) [adjusted p-valuesd] | |||||||||
| Peaceful | 2.01 (1.88–2.14) | 1.96 (1.81–2.11) | 514 | 0.65 | 2.03 (1.98–2.08) | 2.05 (2.01–2.09) | 4829 | 0.61 | 0.30 |
| Energetic | 2.13 (2.00–2.26) | 2.14 (1.99–2.29) | 513 | 0.92 | 2.11 (2.06–2.16) | 2.18 (2.13–2.22) | 4838 | 0.06 | 0.83 |
| Depressed | 5.19 (5.07–5.31) | 5.23 (5.09–5.37) | 513 | 0.69 | 5.21 (5.16–5.25) | 5.18 (5.14–5.23) | 4839 | 0.48 | 0.77 |
| Lethargic | 4.21 (4.06–4.35) | 4.3 (4.15–4.44) | 514 | 0.39 | 4.38 (4.33–4.42) | 4.33 (4.29–4.38) | 4814 | 0.18 | 0.05 |
| Nervous | 3.68 (3.61–3.76) | 3.66 (3.58–3.74) | 513 | 0.70 | 3.64 (3.62–3.67) | 3.58 (3.55–3.60) | 4848 | 0.0007 | 0.04 |
| Still enjoy things | 1.35 (1.26–1.44) | 1.34 (1.25–1.43) | 513 | 0.91 | 1.38 (1.34–1.41) | 1.38 (1.35–1.41) | 4839 | 0.80 | 0.36 |
| Afraid | 3.69 (3.61–3.76) | 3.64 (3.55–3.73) | 513 | 0.45 | 3.69 (3.66–3.71) | 3.62 (3.60–3.65) | 4845 | 0.001 | 0.71 |
| Can still laugh | 1.45 (1.35–1.56) | 1.38 (1.28–1.48) | 513 | 0.30 | 1.34 (1.31–1.37) | 1.39 (1.36–1.42) | 4845 | 0.02 | 0.16 |
| Worried | 3.53 (3.43–3.62) | 3.58 (3.49–3.67) | 511 | 0.44 | 3.58 (3.55–3.61) | 3.54 (3.51–3.57) | 4845 | 0.08 | 0.91 |
| Happy | 3.52 (3.42–3.62) | 3.59 (3.48–3.69) | 513 | 0.37 | 3.61 (3.57–3.64) | 3.61 (3.58–3.64) | 4850 | 0.99 | 0.15 |
| Relaxed | 1.61 (1.51–1.71) | 1.56 (1.46–1.66) | 513 | 0.48 | 1.55 (1.52–1.58) | 1.59 (1.56–1.62) | 4846 | 0.10 | 0.68 |
| Dullness | 3.52 (3.43–3.61) | 3.66 (3.58–3.74) | 513 | 0.02 | 3.6 (3.57–3.63) | 3.53 (3.50–3.56) | 4844 | 0.0008 | 0.51 |
| Frightened | 1.34 (1.27–1.42) | 1.35 (1.26–1.44) | 513 | 0.88 | 1.29 (1.27–1.32) | 1.36 (1.33–1.38) | 4841 | 0.0005 | 0.55 |
| Don’t care about appearance | 3.34 (3.22–3.46) | 3.43 (3.31–3.56) | 512 | 0.31 | 3.45 (3.41–3.49) | 3.47 (3.44–3.51) | 4843 | 0.39 | 0.08 |
| Tired | 3.44 (3.33–3.55) | 3.44 (3.32–3.56) | 513 | 0.96 | 3.41 (3.37–3.44) | 3.39 (3.35–3.43) | 4846 | 0.57 | 0.34 |
| Enthusiasm | 1.37 (1.28–1.45) | 1.38 (1.28–1.48) | 512 | 0.86 | 1.37 (1.33–1.40) | 1.36 (1.34–1.39) | 4847 | 0.92 | 0.85 |
| Panic | 3.78 (3.72–3.84) | 3.75 (3.68–3.82) | 512 | 0.52 | 3.78 (3.76–3.80) | 3.72 (3.70–3.74) | 4850 | 0.0002 | 0.47 |
| GERD Q, mean (95% CI) [adjusted p-valuesd] | |||||||||
| Heartburn | 1.10 (1.05–1.15) | 1.10 (1.05–1.15) | 518 | 0.99 | 1.07 (1.06–1.09) | 1.09 (1.08–1.11) | 4866 | 0.07 | 0.22 |
| Reflux | 1.11 (1.06–1.15) | 1.08 (1.03–1.13) | 518 | 0.40 | 1.09 (1.08–1.11) | 1.10 (1.09–1.12) | 4864 | 0.44 | 0.92 |
| Mid abdominal pain | 1.09 (1.04–1.13) | 1.07 (1.03–1.11) | 518 | 0.56 | 1.07 (1.05–1.08) | 1.09 (1.07–1.10) | 4864 | 0.04 | 0.89 |
| Nausea | 1.04 (1.02–1.07) | 1.05 (1.01–1.09) | 518 | 0.77 | 1.07 (1.06–1.09) | 1.07 (1.06–1.08) | 4866 | 0.69 | 0.11 |
| Less sleep | 1.04 (1.01–1.07) | 1.05 (1.02–1.09) | 518 | 0.45 | 1.06 (1.04–1.07) | 1.06 (1.04–1.07) | 4868 | 0.85 | 0.39 |
| Drug for reflux | 1.01 (0.99–1.03) | 1.04 (1.00–1.08) | 518 | 0.12 | 1.03 (1.02–1.05) | 1.03 (1.02–1.04) | 4867 | 0.74 | 0.48 |
| Blood environment, mean (95% CI) [adjusted p-valuesd] | |||||||||
| WBC | 6.54 (6.30–6.77) | 6.23 (5.99–6.48) | 495 | 0.08 | 6.50 (6.43–6.58) | 5.96 (5.9–6.02) | 4616 | <0.0001 | 0.02 |
| NEU rate | 59.61 (58.35–60.86) | 60.21 (58.77–61.64) | 497 | 0.53 | 58.74 (58.28–59.20) | 59.7 (59.3–60.11) | 4614 | 0.002 | 0.218 |
| EOS rate | 2.64 (2.35–2.94) | 2.55 (2.19–2.92) | 476 | 0.70 | 2.40 (2.30–2.50) | 2.11 (2.02–2.20) | 4467 | <0.0001 | 0.0010 |
| RBC | 4.96 (4.90–5.03) | 4.57 (4.49–4.65) | 497 | <0.0001 | 5.22 (5.19–5.24) | 4.59 (4.57–4.61) | 4616 | <0.0001 | 0.001 |
| HGB | 154.12 (152.02–156.21) | 135.62 (133.25–137.99) | 497 | <0.0001 | 160.26 (159.62–160.89) | 136.5 (135.95–137.05) | 4616 | <0.0001 | 0.08 |
| PLT | 173.56 (166.81–180.31) | 185.66 (177.46–193.87) | 496 | 0.02 | 187.44 (185.08–189.79) | 197.37 (194.93–199.81) | 4608 | <0.0001 | <0.0001 |
| FBG | 5.47 (5.29–5.64) | 5.18 (5.03–5.33) | 476 | 0.02 | 5.40 (5.35–5.46) | 5.29 (5.24–5.35) | 4504 | 0.004 | 0.87 |
| TC | 1.76 (1.59–1.94) | 1.67 (1.52–1.81) | 474 | 0.41 | 1.84 (1.78–1.90) | 1.62 (1.58–1.66) | 4491 | <0.0001 | 0.98 |
| TCH | 5.10 (4.98–5.23) | 5.07 (4.92–5.22) | 478 | 0.72 | 4.89 (4.84–4.94) | 4.96 (4.91–5.00) | 4518 | 0.04 | 0.002 |
a p for difference: a chi-squared test was conducted to evaluate the discrepancy in the distribution of men and women among COPD patients, with the FDR-adjusted p value presented.
b p for difference: a chi-squared test was conducted to evaluate the discrepancy in the distribution of men and women among the non-COPD population, with the FDR-adjusted p value presented.
DISCUSSION
COPD is the fourth leading cause of death globally and the third leading cause of mortality in China1,6. It is caused by dynamic, cumulative, and repeated interactions between genes and the environment throughout a person’s lifetime, which can harm the lungs and disrupt their normal development and aging processes12. GOLD 2001 proposed the concept of GOLD stage 0, which means that patients have high-risk factors for COPD and persistent respiratory symptoms, but there is no airflow limitation as measured by the pneumometer (FEV1/FVC>0.7 after inhalation of bronchodilators), and it emphasizes that patients in GOLD stage 0 are at high risk of developing COPD in the future7,13,14. Since COPD begins in the early stages of life and it takes a long time for clinical symptoms to appear, GOLD 2024 suggests that early-stage COPD is defined as the biological early stage of the disease course15. ‘Biological early stage’ usually refers to the early stage of disease development. At this time, patients may not have obvious clinical symptoms yet, but there is already a certain degree of damage to the lungs and abnormal lung function trajectories (abnormal lung development and rapid decline in lung function). The early stage of life is a crucial period for lung growth and development. Early life risk factors such as intrauterine tobacco exposure, low birthweight and premature birth, severe respiratory tract infections in childhood, pneumonia or bronchitis, secondhand smoke exposure, and family poverty are closely related to the onset of chronic obstructive pulmonary disease in adulthood8,16.
Our research has found that smoking, including active or passive smoking during pregnancy, coal-based biofuels, cooking methods such as frying, stir-frying, and grilling, indoor smoke exposure, and low level of education etc., are all associated factors for COPD and Pre-COPD. Consistent with the literature reports17-19. Liu et al.20 reported that just three days of exposure to kitchen cooking fumes can cause pneumonia and damage the intestines, and seven days of continuous exposure is even more severe. Therefore, this research underscores the influence of environmental and lifestyle factors on the development of COPD and Pre-COPD.
With a rapidly aging population and heavy household and outdoor air pollutants, crowding, poor nutrition, infections, or other factors related to low socioeconomic status, the prevalence of COPD is expected to continue to rise9. The term ‘pre-disease stage’ refers to an intermediate state between health and disease, in which certain pathological biological mechanisms involved in disease progression have already been activated, but the possibility of returning to normal still exists21. Hence, terms such as ‘early COPD’, ‘mild COPD’, ‘young COPD’, and ‘Pre-COPD’ in the Global Initiative for Chronic Obstructive Lung Disease 2023 Report were proposed9,16. However, at present, research reports on ‘early COPD’, ‘mild COPD’, ‘young COPD’, and ‘Pre-COPD’ are rare. Martinez et al.22 highlighted the need to distinguish ‘early disease’ from late ‘mild disease’, proposed an operational definition of early COPD for use in research studies, and attempted to unify current views on potential disease mechanisms. The term ‘Pre-COPD’ describes a diverse set of conditions in which certain characteristics of COPD are evident, yet the defining characteristic of COPD – persistent chronic airflow obstruction – is absent7,23. Çolak et al.24 discussed the occurrence of COPD during follow-up in individuals who did not display airflow obstruction, defined as FEV1/FVC<0.7, yet have any of the following conditions, which they classify as a pre-disease state of COPD: 1) symptoms of chronic bronchitis; 2) PRISm (preserved ratio impaired spirometry with FEV1/FVC ≥70% and FEV1 <80% predicted); 3) ‘early airflow limitation’ with FEV1/FVC >70% but <LLN (Lower Limit of Normal); or 4) asthma. According to the criteria proposed by Çolak et al.24, there were 1264 adult subjects considered to have Pre-COPD, accounting for 8.92% of the total study subjects; but the age-standardized prevalence of Pre-COPD was 7.20% (95% CI: 5.9–8.8) in the China Pulmonary Health study. Although we found no significant difference in mood among those with COPD, previous research has showed that preserved ratio impaired spirometry (PRISm) and airflow obstruction carry equally high risks of depression and anxiety. PRISm recognition may contribute to the prevention of depression and anxiety25. Thus, inconsistent with previous reports, we attribute this discrepancy to our limited sample size. Wang et al.26 conducted a survey among Chinese people aged >20 years and found that the age-standardized prevalences of PRISm, Pre-COPD, young COPD, and mild COPD approximately were 5.5%, 7.2%, 1.1%, and 3.1%, respectively. For example, only a small proportion of PRISm and Pre-COPD individuals would certainly progress to affirmed COPD in the coming years27,28. A history of intrauterine tobacco exposure, hospitalization for bronchitis or pneumonia in childhood, frequent cough symptoms, and tobacco smoke exposure were high-risk factors for the future development of COPD in young people and Pre-COPD. Agustí et al.29 reported that approximately a quarter of patients diagnosed and treated with COPD in real life do not fulfil the COPD definition of non-fully reversible airflow limitation, and can be classified instead as having either normal spirometry (Pre-COPD) or a PRISm. Regardless of how they are conceptually considered, one key issue to be resolved is how individuals with Pre-COPD/early COPD will be detected to facilitate the implementation of preventive measures30. Hence, awareness of risk factors is essential for the development of public health policy and rational planning of healthcare resources and contributes to the effective self-management of COPD and Pre-COPD patients. Combining our results, increasing importance should be given to screening and health education on COPD and Pre-COPD in the general population, and lung function tests for people at high risk of COPD for early diagnosis and treatment of the disease to reduce the social and economic burden caused by COPD.
Limitations
Our study has several limitations. First, we used province-level random sampling, yet coverage of remote villages was incomplete, and non-response may have introduced selection bias. Second, the cross-sectional design precludes causal inference, and residual confounding by unmeasured variables (e.g. indoor biomass exposure) cannot be excluded. Third, comparisons between COPD and Pre-COPD groups were unadjusted for multiple covariates, increasing the associated of false-positive findings. Fourth, people with asthma were not excluded from the study population, which might cause an overestimate of COPD prevalence in younger age groups. Finally, because the survey was conducted in a single Chinese province, generalizability to other countries or ethnic groups is limited.
Our findings reveal a concerningly high prevalence of COPD and Pre-COPD among the adult population in Guizhou, driven by a complex interplay of environmental, behavioral, and socio-economic factors. The identified associated factors, particularly those related to smoking and indoor air quality, highlight critical areas for public health intervention and policy reform. Addressing these factors through targeted strategies may prevent people with Pre-COPD from rapidly progressing to COPD, and which mitigate the burden of COPD in this population and contribute to improved respiratory health outcomes. Subsequently, we will continue to follow up the development of patients diagnosed with COPD and Pre-COPD, and further conduct subgroup analyses on the associated factors of COPD in subjects with normal pulmonary ventilation function but chronic bronchitis or small airway dysfunction.
CONCLUSIONS
This analysis shows that the prevalence of COPD and Pre-COPD in Guizhou adults exceeds the national Chinese average. Smoking, including active or passive smoking during pregnancy, coal-based biofuels, cooking methods such as frying, stir-frying and grilling, indoor smoke exposure and low level of education, were identified to be higher in the COPD and pre-COPD population groups.