


INTRODUCTION
Tobacco smoking remains one of the leading preventable causes of cancer worldwide. Cigarette smoke contains more than 7000 chemical compounds, including at least 69 recognized carcinogens such as polycyclic aromatic hydrocarbons and tobacco-specific nitrosamines1,2. The International Agency for Research on Cancer (IARC) has classified tobacco smoking as a Group 1 carcinogen and has established causal associations with at least 17 cancer types, including cancers of the lung, esophagus, bladder, liver, pancreas, and cervix3. Smoking-related carcinogenesis is mediated through multiple mechanisms, including DNA damage, somatic mutations in oncogenes and tumor suppressor genes, chronic inflammation, oxidative stress, and epigenetic dysregulation4. In addition to active smoking, secondhand smoke exposure is also associated with increased cancer risk among non-smokers1.
Emerging evidence further suggests that maternal smoking during pregnancy may exert long-term health effects on offspring, including an increased risk of certain malignancies later in life5. Neuroblastoma (NB) is the most common extracranial solid malignancy of childhood, accounting for approximately 7% of pediatric cancers and 15% of childhood cancer-related deaths worldwide6. Despite substantial advances in multimodal treatment strategies, outcomes remain poor for patients with high-risk disease, largely owing to metastatic progression and treatment resistance7. Unlike most adult cancers, NB is characterized by a relatively low mutational burden but frequent chromosomal abnormalities, including deletions of chromosome arms 1p and 11q and gain of 17q8. These genomic alterations highlight the importance of tumor suppressor genes in NB pathogenesis. Neuroblastoma suppressor of tumorigenicity 1 (NBL1), also known as DAN, is a secreted glycoprotein encoded by a gene located on chromosome 1p36.12, a region commonly deleted in NB9. NBL1 functions as an antagonist of bone morphogenetic proteins (BMPs) and negatively regulates BMP-Smad signaling, thereby inhibiting cell proliferation and promoting cellular differentiation10. Tobacco carcinogens drive epigenetic silencing and chromosomal damage at the NBL1 gene locus, reducing NBL1 protein abundance and disrupting tumor-suppressive BMP signal11. Downregulation or silencing of NBL1 is commonly observed in NB tissues, especially in high-risk cases with MYCN amplification. Genomic deletion of 1p covering the NBL1 locus further leads to its reduced expression, which is closely correlated with advanced clinical stage, aggressive tumor phenotypes, and poor patient survival12. Functional experiments have verified that ectopic NBL1 expression suppresses the malignant behaviors of NB cells. Collectively, NBL1 acts as a vital tumor suppressor and independent prognostic biomarker in neuroblastoma13.
Mendelian randomization (MR) is an analytical approach that uses genetic variants as instrumental variables to infer causal relationships between exposures and outcomes. Because genetic variants are randomly allocated at conception, MR analyses are less vulnerable to residual confounding and reverse causality than traditional observational studies. The increasing availability of large-scale genome-wide association studies (GWAS) has further enhanced the utility of MR for investigating potential causal mechanisms in complex diseases14. Two-sample MR, in particular, utilizes summary-level GWAS data from separate but comparable populations to estimate the causal effect of an exposure on an outcome.
Existing observational links between tobacco smoke and childhood neuroblastoma are limited by confounding, unknown NBL1-mediated mechanisms, and incomplete smoking phenotype stratification, with no two-sample MR evidence clarifying the full causal pathway connecting diverse smoking exposures, circulating NBL1, and neuroblastoma risk. To our knowledge, this is the first study to investigate the potential causal relationship between smoking-related exposures and NBL1 using an MR framework. Two-sample MR analyses were implemented to quantify causal effects of three smoking phenotypes (perinatal smoking, household smoke exposure, personal smoking initiation; GWAS IDs: ukb-b-17685, ukb-a-18, ieu-b-4877) on circulating NBL1 concentrations (prot-a-2003).
METHODS
Data source
This study was conducted in accordance with the STROBE-MR reporting guidelines and the core assumptions of Mendelian randomization (MR) (Supplementary file Table S1)15.
This is a bidirectional two-sample Mendelian randomization study design using genome-wide association study (GWAS) summary statistics for potential inference. Summary-level GWAS data for maternal smoking around birth were obtained from the UK Biobank dataset (ukb-b-17685), comprising 397732 participants and 9851867 single-nucleotide polymorphisms (SNPs)16. Data for household smoking exposure were derived from the UK Biobank dataset (ukb-a-18), which included 311142 individuals of European ancestry and 10894596 SNPs17. GWAS summary statistics for smoking initiation were obtained from the IEU OpenGWAS database (ieu-b-4877), including 311629 cases, 321173 controls, and 11802365 SNPs18.
Outcome data for neuroblastoma suppressor of tumorigenicity 1 (NBL1) were obtained from the Genomic Atlas of the Human Plasma Proteome (prot-a-2003). In this study, 3622 plasma proteins were quantified using the SomaScan 4.0 platform in 3301 healthy European participants from the INTERVAL cohort19. Detailed characteristics of all datasets are summarized in Table 1.
Table 1
Characteristics of the datasets
Instrumental variable selection
Instrumental variables (IVs) were selected using stringent criteria to ensure the validity of causal inference. SNPs associated with each exposure at genome-wide significance (p<5×10⁻⁸) were selected. For household smoking exposure, the threshold was relaxed to p<5×10⁻⁶ because of the limited number of eligible variants. To ensure independence among IVs, linkage disequilibrium (LD) clumping was performed using an r2 threshold of <0.001 within a 10000kb window. SNPs with a minor allele frequency below 1% were excluded. Potentially pleiotropic variants associated with known confounders, cancer-related traits, or lung-development phenotypes were identified and removed using the FastTraitR package (version 1.0.1).
The proportion of variance explained (R2) by each SNP was calculated as:
where β represents the SNP–exposure effect estimate, EAF denotes the effect allele frequency, SE is the standard error, and N is the sample size. Instrument strength was evaluated using the F statistic, with F >10 considered indicative of sufficient instrument strength.
Statistical analysis
Two-sample MR analyses were performed using R software (version 4.3.2) and the TwoSampleMR package (version 0.6.29). The inverse-variance weighted (IVW) method20,21 was used as the primary analytical approach. Weighted median22 and MR-Egger regression analyses23 were performed as complementary methods to evaluate the robustness of the findings. Causal effects are reported as odds ratios (ORs) with corresponding 95% confidence intervals (CIs). A p<0.05 was considered statistically significant.
Sensitivity analyses
Several sensitivity analyses were conducted to assess the validity of the MR assumptions: 1) MR-Egger intercept test to detect horizontal pleiotropy; 2) Cochran’s Q test to evaluate heterogeneity among instrumental variables; and 3) Leave-one-out analysis to determine whether individual SNPs disproportionately influenced the overall estimates24.
RESULTS
Associations between smoking exposures and neuroblastoma suppressor of tumorigenicity 1 (NBL1)
The causal effects of three smoking-related exposures on circulating NBL1 levels are summarized in Table 2. For maternal smoking around birth, 66 independent SNPs were selected as instrumental variables at the genome-wide significance threshold (p<5×10⁻⁸). No evidence of a causal association with NBL1 levels was observed using the IVW method (OR=0.40; 95% CI: 0.12–1.30, p=0.13). Consistent null results were obtained using the weighted median (OR=0.55, 95% CI: 0.11–2.86, p=0.48) and MR-Egger methods (OR=0.08; 95% CI: 0.00–3.59, p=0.12).
Table 2
Mendelian randomization results for the association between the three exposures and NBL1, IEU OpenGWAS 2017, 2018, 2019 and 2023
For household smoking exposure, 17 independent SNPs were included following instrument selection at p<5×10⁻⁶. No significant association with NBL1 levels was identified by the IVW method (OR=3.72; 95% CI: 0.08–171.13, p=0.50), weighted median estimator (OR=1.42; 95% CI: 0.02–110.18, p=0.88), or MR-Egger regression (OR=1.68; 95% CI: 0.00–64768.32, p=0.92).
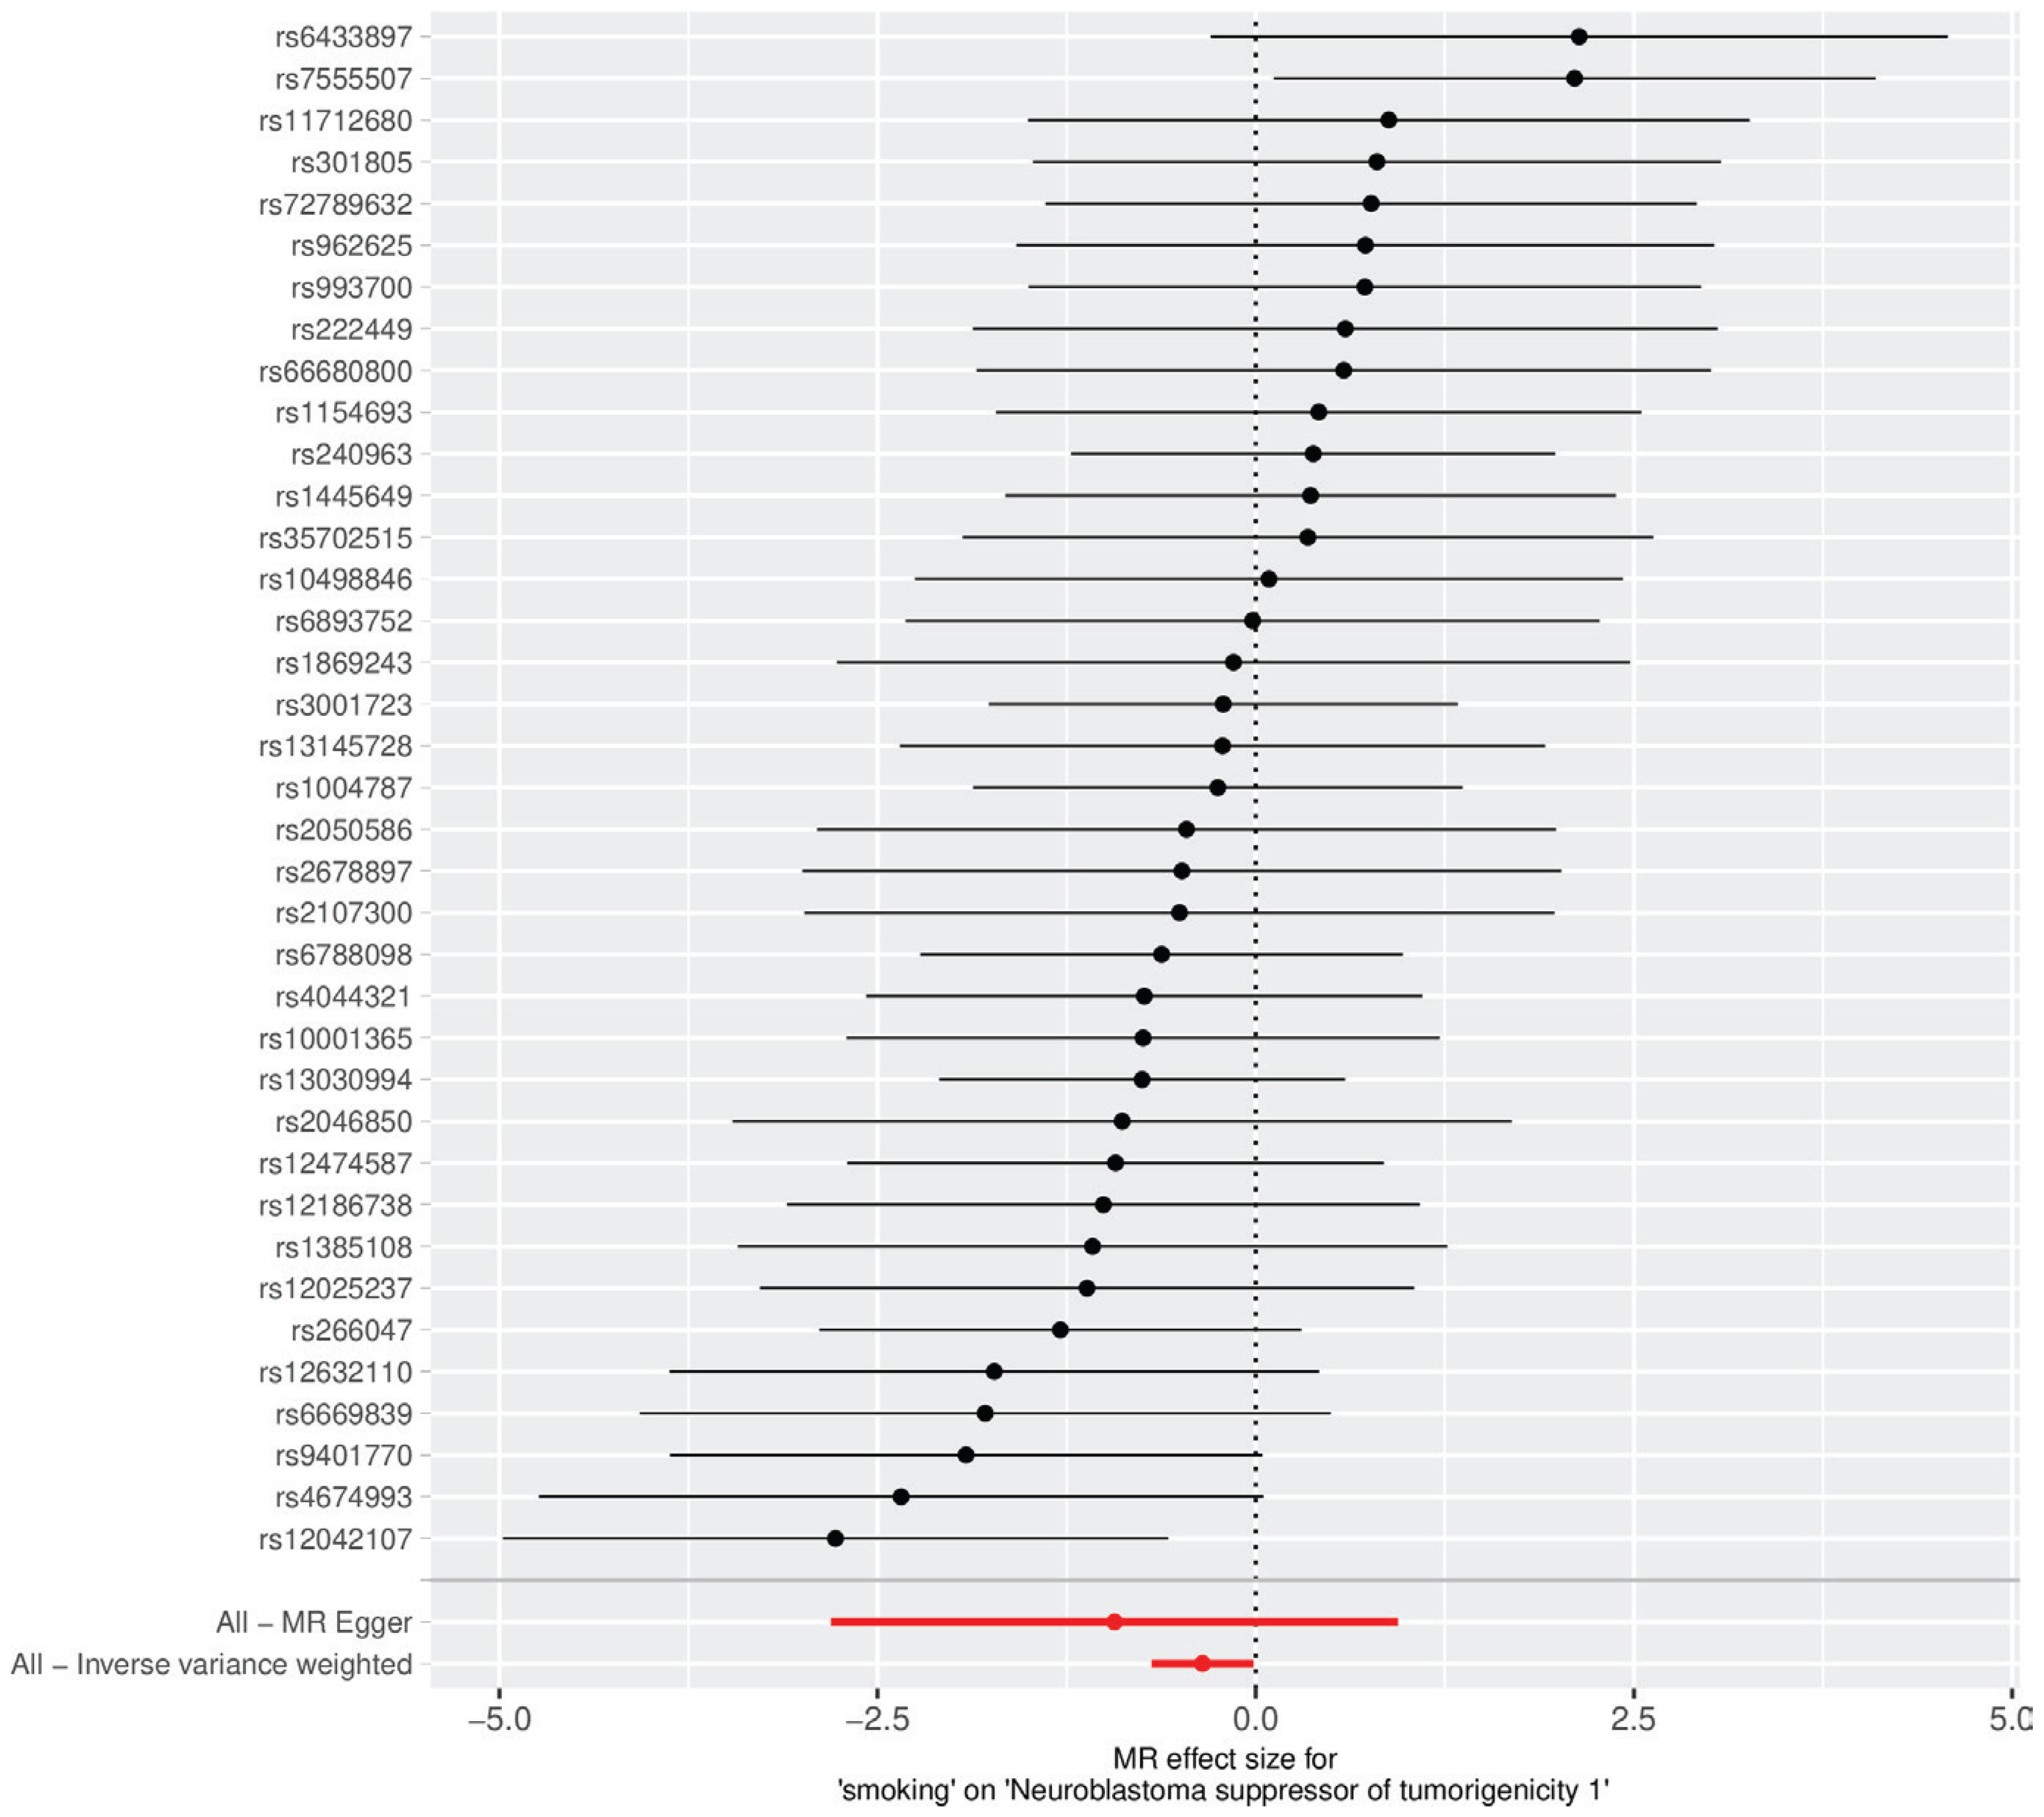
For smoking initiation, 37 genome-wide significant SNPs (p<5×10⁻⁸) were selected as instrumental variables following stringent quality control and clumping procedures (Figure 1). The primary IVW analysis demonstrated a significant inverse association between genetically predicted smoking initiation and circulating NBL1 levels (OR=0.70; 95% CI: 0.50–0.99, p=0.04). The weighted median analysis yielded a similar effect estimate, although statistical significance was not reached (OR=0.64; 95% CI: 0.40–1.04, p=0.07). MR-Egger regression showed a consistent direction of effect but with wider confidence intervals (OR=0.39; 95% CI: 0.06–2.56, p=0.34). Scatter plots (Figure 2) and forest plots (Figure 3) demonstrated overall concordance across MR approaches.
Figure 1
Manhattan plot showing genome-wide significant SNPs associated with smoking initiation, data from IEU OpenGWAS in 2019
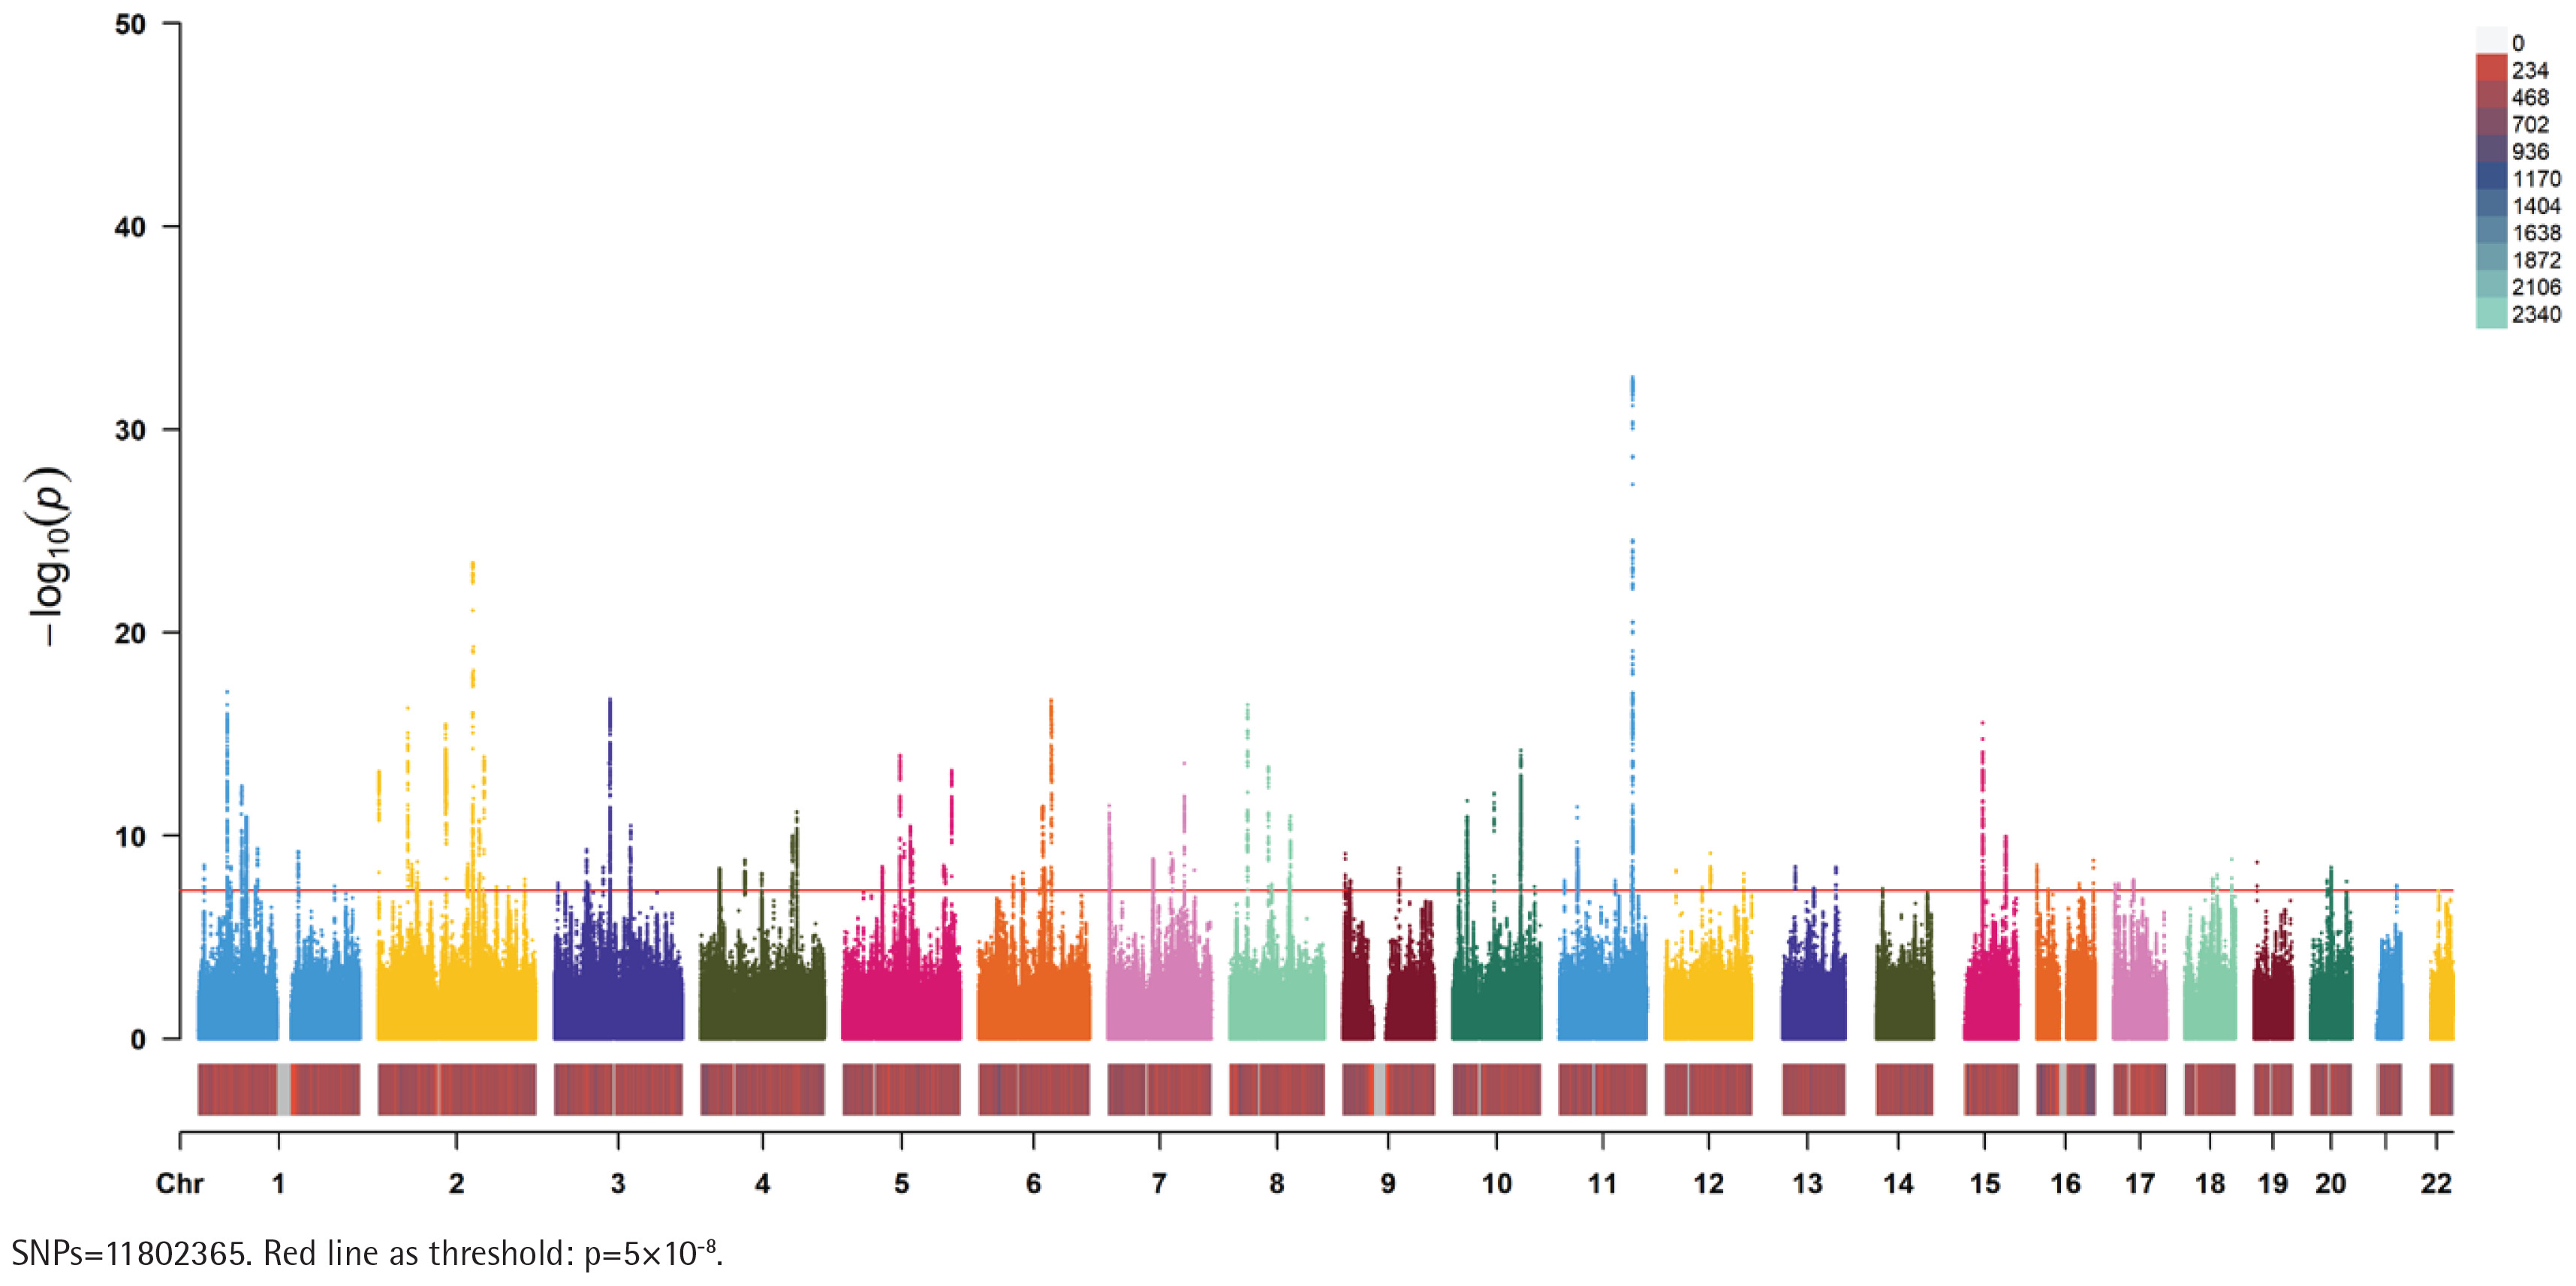
Figure 2
Scatter plot showing the associations of instrumental SNPs with smoking initiation and NBL1 expression. Each point represents an SNP effect estimate with 95% confidence intervals. The fitted lines correspond to causal estimates obtained using the IVW, weighted median, and MR-Egger methods, IEU OpenGWAS 2018 and 2019 (N=314930)
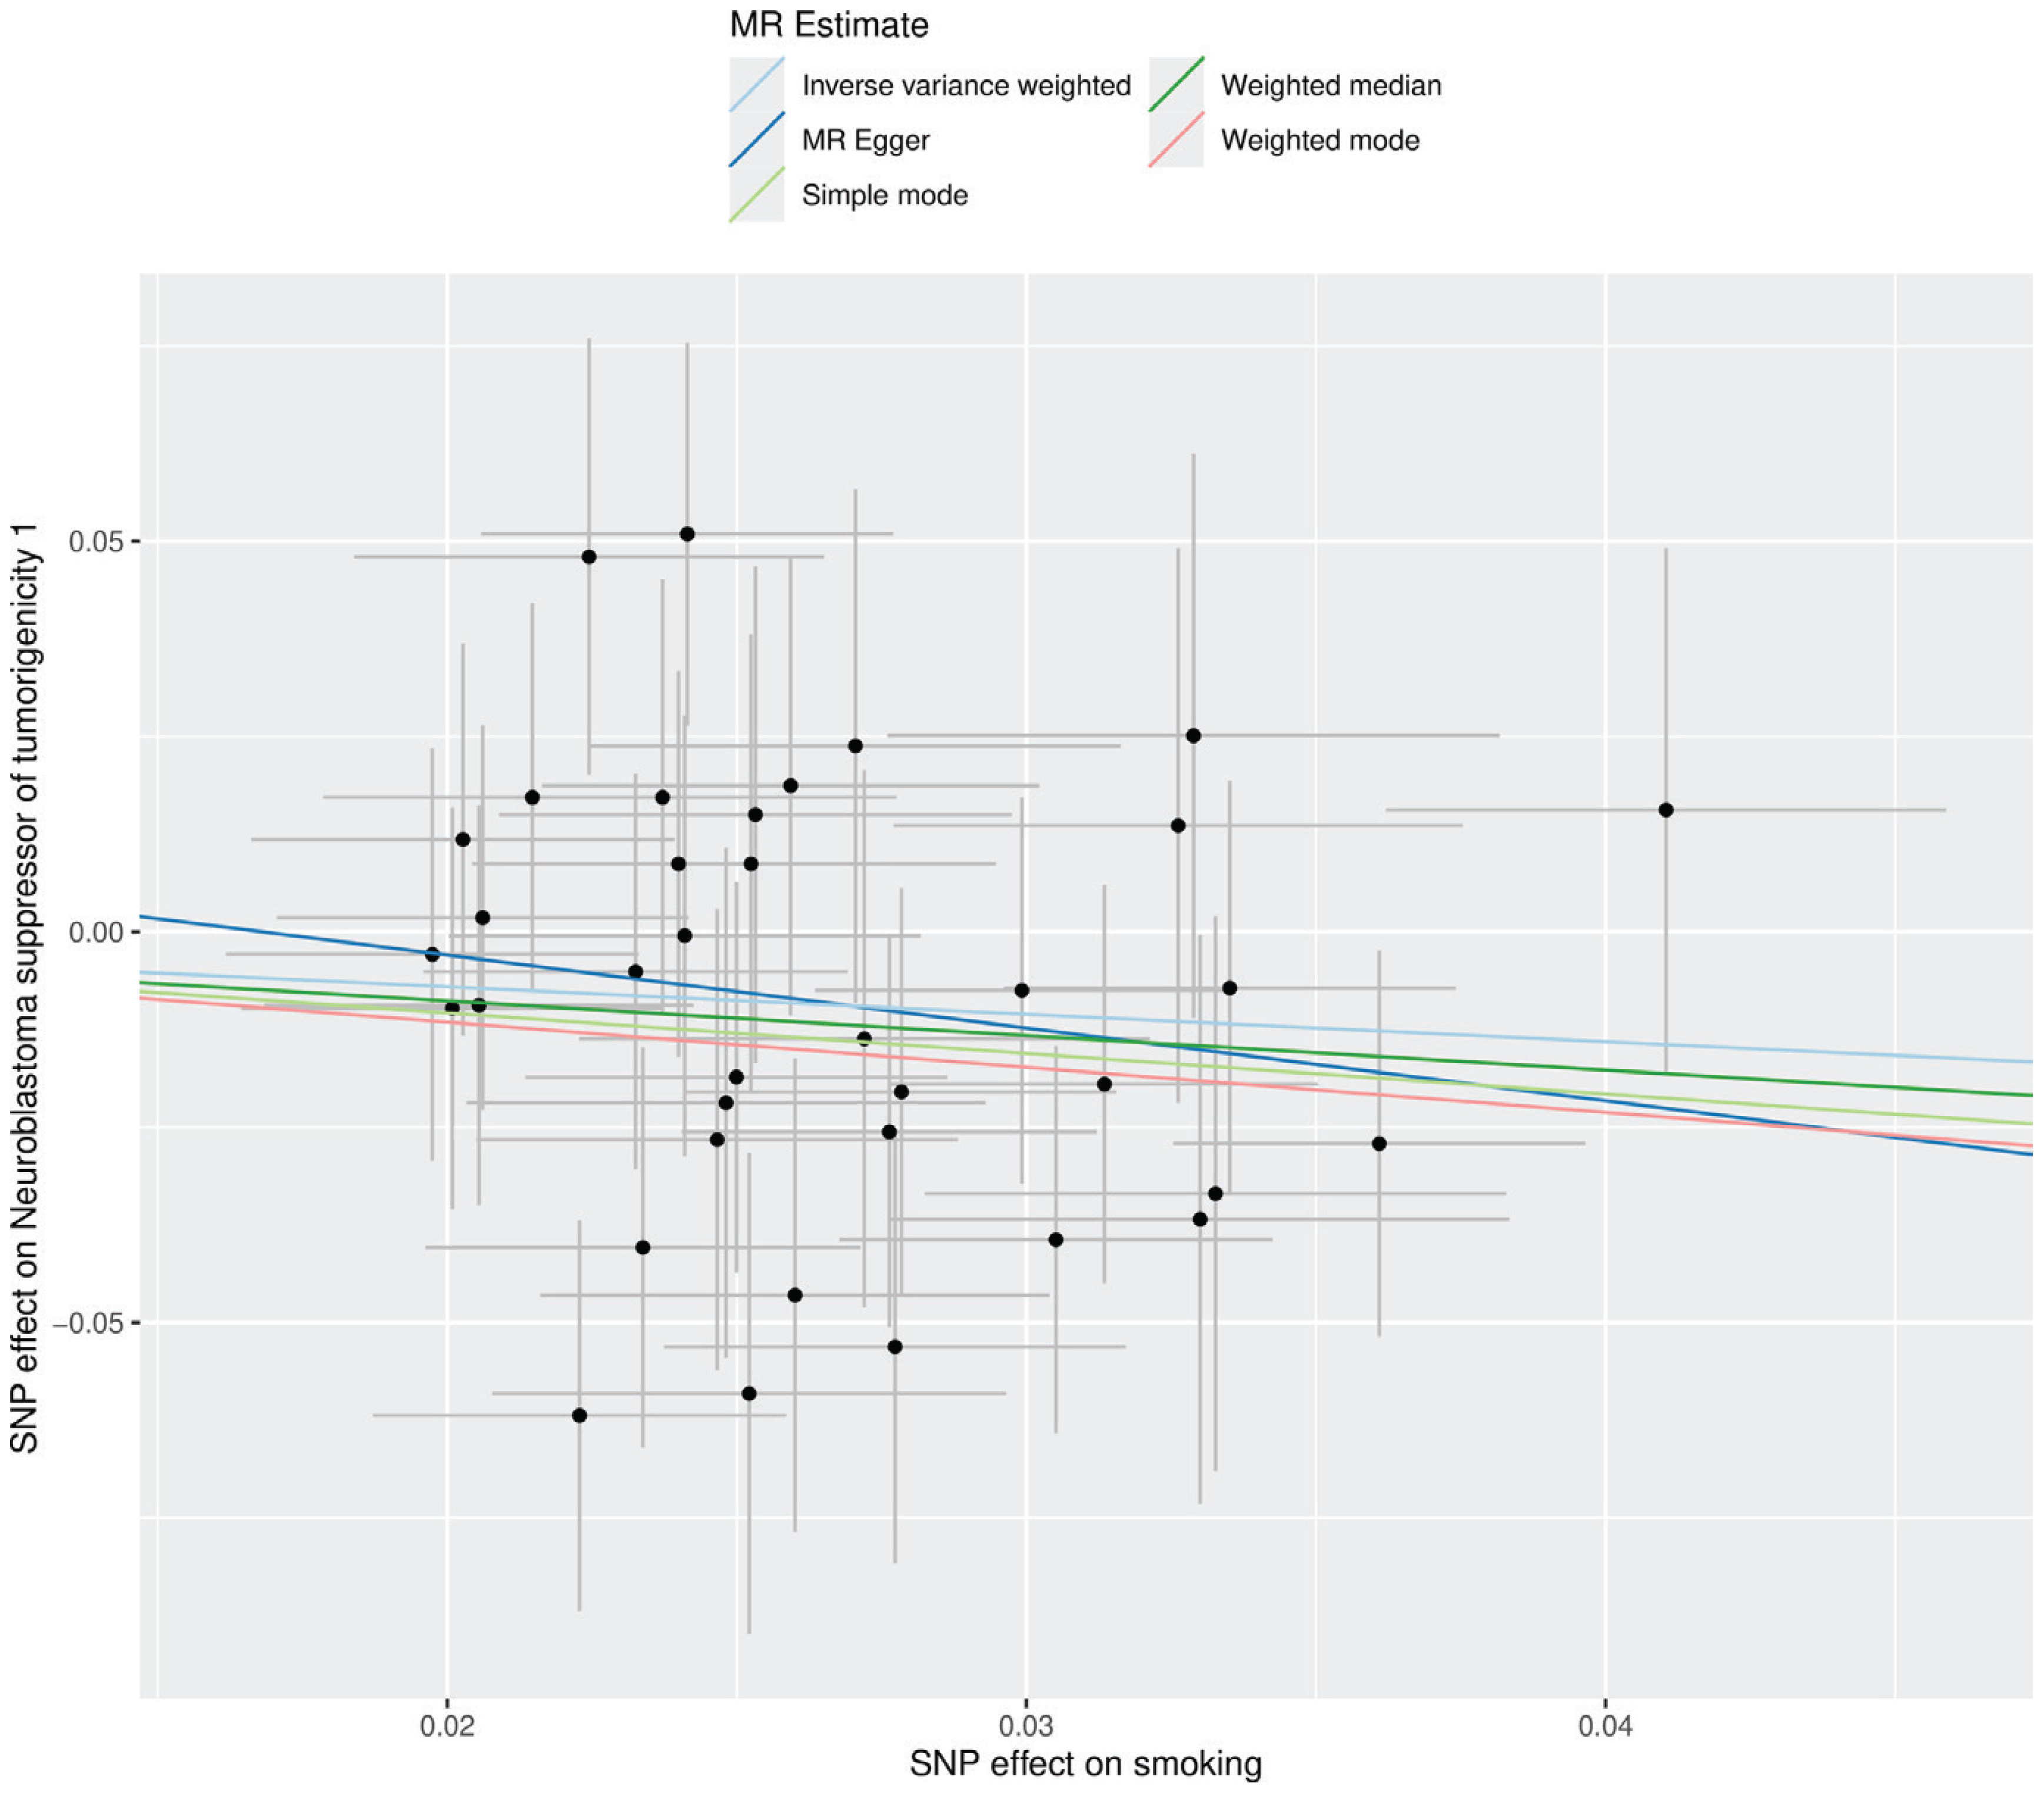
Figure 3
Forest plot of SNP-specific Mendelian randomization estimates for the association between smoking initiation and NBL1 expression. Black dots indicate effect estimates, and horizontal bars represent 95% confidence intervals, data from 2018 and 2019 (N=311629 for smoking initiation; N=3301 for NBL1)
Detailed information of the included SNPs
Table 3 provides comprehensive details for each SNP, including the effect allele (EA) and its frequency (EAF) in the exposure, which is significantly associated with the outcome. It also includes estimates of their associations with smoking and NBL1, encompassing β values, standard errors (SE), and corresponding p values.
Table 3
Association analysis for smoking-decreasing GWAS risk alleles with the NBL1, IEU OpenGWAS 2017, 2018, 2019 and 2023
[i] CHR: chromosome. EA: effect allele. EAF: effect allele frequency. SE: standard error. SNPs: single-nucleotide polymorphisms. NBL1: neuroblastoma suppressor of tumorigenicity 1. N=397732 for maternal smoking around birth. N=311142 for smoking in household. N=311629 for smoking initiation. N=3301 for neuroblastoma suppressor of tumorigenicity 1.
Sensitivity analysis
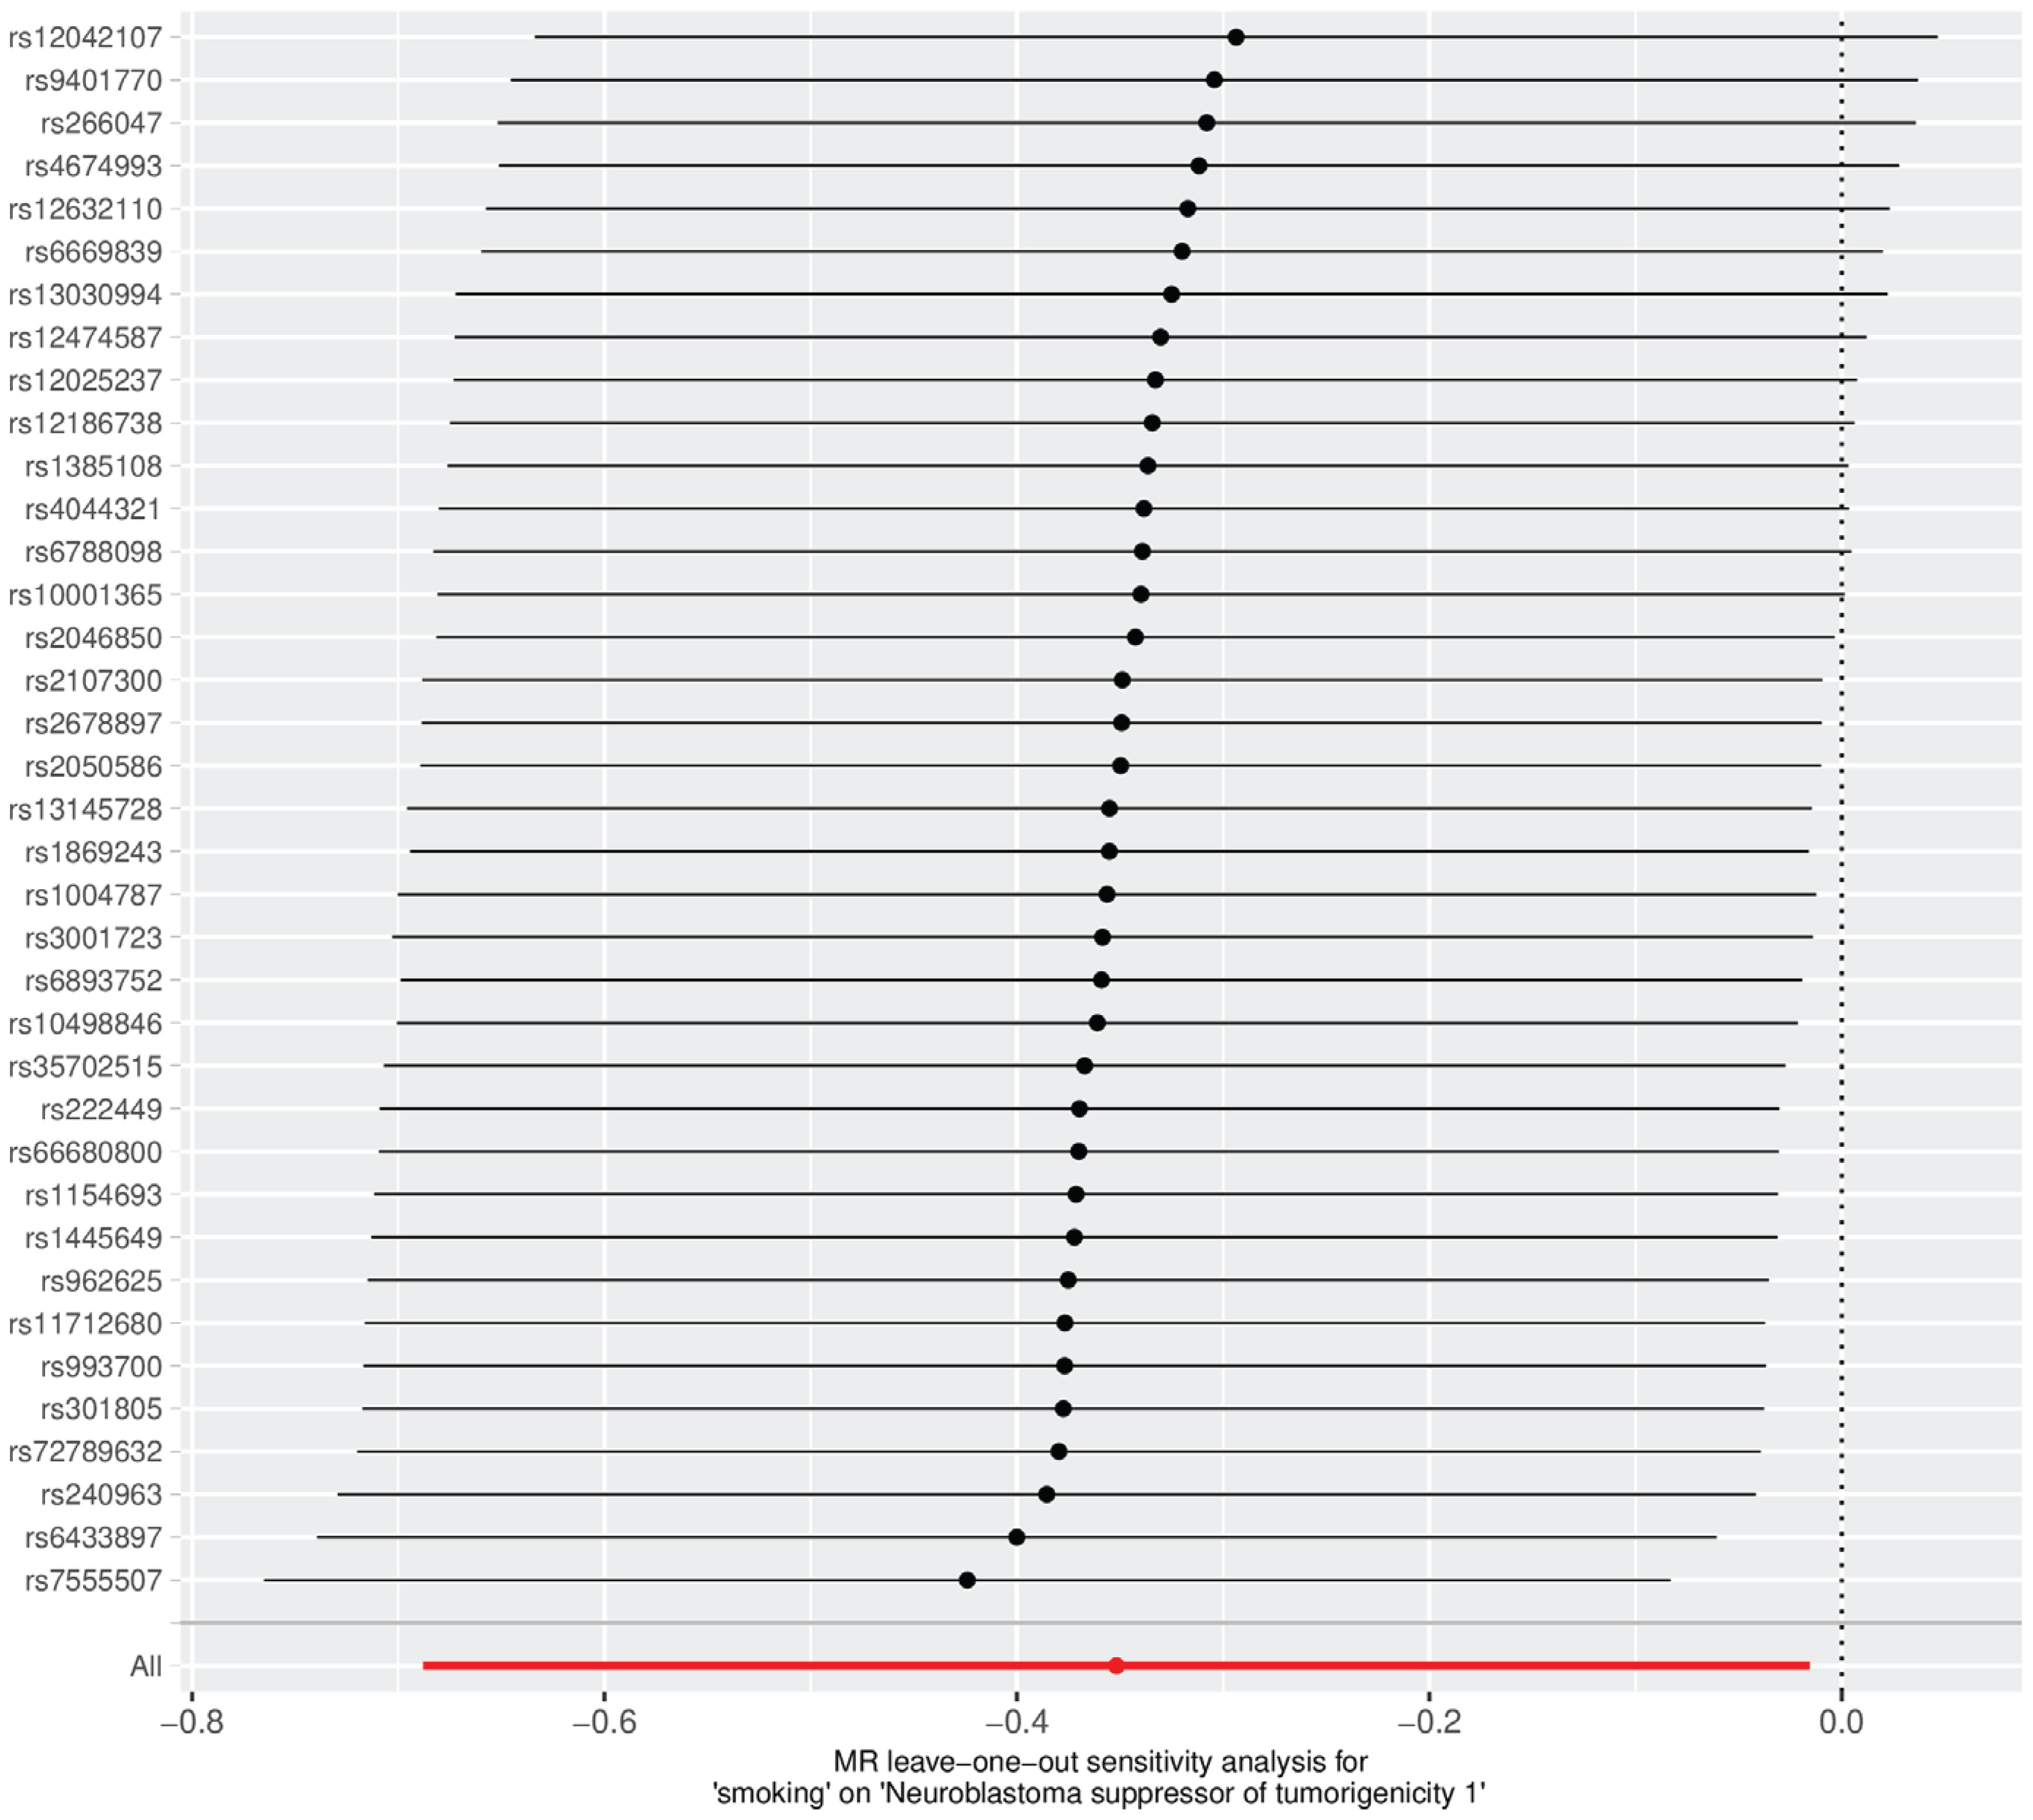
No evidence of directional pleiotropy was detected for any exposure. Cochran’s Q test indicated no significant heterogeneity for maternal smoking around birth or smoking initiation, whereas heterogeneity was observed for household smoking exposure (Table 4). Leave-one-out analyses showed that no individual SNP disproportionately influenced the observed association between smoking initiation and NBL1 expression (Figure 4).
The reverse MR
To assess potential reverse causality, reverse MR analyses were performed using NBL1-associated SNPs as instrumental variables. Because no variants reached genome-wide significance (p<5×10⁻⁸), 15 independent SNPs were selected using a relaxed threshold of p<5×10⁻⁶. The IVW analysis provided no evidence that NBL1 levels causally influence smoking initiation (Supplementary file Table S2). Additionally, leave-one-out sensitivity analysis revealed heterogeneity across SNPs when assessed individually against the collective set (Supplementary file Figure 1).
Validation analysis using neuroblastoma risk
To verify that the observed inverse association was specific to NBL1 rather than NB, we conducted an additional MR analysis of smoking and NB using the ieu-a-816 GWAS dataset25. The dataset comprised 1627 NB cases, 3254 controls, and 468788 SNPs, from which 10 instrumental SNPs were selected. No causal association between smoking and NB was identified across any MR method (IVW: OR=1.05; 95% CI: 0.36–3.05, p=0.93; weighted median: OR=0.93; 95% CI: 0.21–4.04, p=0.92; MR-Egger: OR=0.09; 95% CI: 0.00–3.79, p=0.24) (Supplementary file Table S3).
DISCUSSION
To ensure robust inference, this study selected maternal smoking around birth, smoking initiation, and household smoking exposure as instrumental variables (IVs), representing intergenerational, individual behavioral, and secondhand smoking effects, respectively. Potentially pleiotropic variants linked to known confounders, including cancer-related dyslipidemia (‘rs6728726’, ‘rs2378662’) and lung development traits (‘rs3800227’)26, were excluded using the FastTraitR package. All IVs exhibited sufficient strength (F-statistic >10). Using complementary MR approaches, including inverse-variance weighted (IVW), weighted median, and MR-Egger analyses, this study identified a potential inverse association between genetically predicted smoking initiation and NBL1 expression. In contrast, maternal smoking around birth and household smoking exposure showed no significant effects on NBL1. Sensitivity analyses detected no evidence of horizontal pleiotropy or influential outliers, and replication across independent GWAS datasets further strengthened the robustness of the findings. Reverse MR analyses provided no evidence that NBL1 expression influences smoking behavior, supporting the inferred causal direction.
Tobacco control remains a major global public health priority. Secondhand smoke exposure continues to represent a substantial environmental risk, disproportionately affecting vulnerable populations such as children, pregnant women, and non-smokers1. Cigarette smoke contains thousands of chemical compounds, including nicotine, tar, and formaldehyde. These toxic components induce oxidative stress and trigger the release of pro-inflammatory cytokines, including IL-6, IL-8, IL-17, and TNF-α, thereby amplifying systemic inflammation and promoting carcinogenesis27.
NBL1 (known as DAN) is a well-characterized antagonist of bone morphogenetic protein (BMP) signaling, particularly BMP-2 and BMP-7. It has been widely studied in developmental and tumor biology as a key modulator of cellular differentiation and proliferation28. Emerging evidence also suggests that NBL1 may attenuate neuroinflammation through BMP-dependent microglial activation pathways29. In pulmonary vascular disease models, NBL1 has been shown to suppress PDGF-BB-induced proliferation of human pulmonary artery smooth muscle cells, thereby inhibiting vascular remodeling26. Beyond neuroblastoma, NBL1 also exerts tumor-suppressive effects in several malignancies, including prostate cancer and small-cell lung cancer30,31.
Despite growing evidence linking smoking to multiple malignancies11, its potential role in NB and the underlying molecular mechanisms remain largely unexplored. The study performed a comprehensive bidirectional MR analysis to investigate the causal relationships between smoking-related exposures, NBL1 expression, and NB risk. Compared with conventional observational studies, MR analyses reduce susceptibility to residual confounding and reverse causation. These findings have several important implications. First, maternal smoking exposure does not appear to increase offspring NB risk through NBL1-mediated mechanisms. Second, secondhand smoke exposure is unlikely to contribute to NB development via alterations in NBL1 expression. Third, although smoking initiation was associated with reduced NBL1 expression, this relationship is unlikely to influence NB because smoking exposure typically occurs after the peak incidence period of this pediatric malignancy. Instead, smoking-induced NBL1 downregulation may be more relevant to the pathogenesis of adult-onset cancers, a hypothesis further supported by these supplementary validation analyses.
Limitations
Several limitations should be acknowledged. First, all GWAS datasets were derived from populations of European ancestry, which may limit the generalizability of these findings. Second, although no substantial horizontal pleiotropy was detected, residual pleiotropic effects cannot be completely excluded. Third, heterogeneity was observed among some instrumental variables, particularly in analyses involving household smoking and NBL1; however, this did not materially alter the causal estimates. Fourth, the two-sample MR design remains vulnerable to potential violations of core MR assumptions and cannot account for unmeasured gene–environment interactions. Finally, because relatively few SNPs were available for certain exposures, a relaxed significance threshold (p<5×10⁻⁶) was adopted. Nevertheless, stringent linkage disequilibrium filtering (r2<0.001 within 10000 kb) and F-statistic exceeding 10 minimized the likelihood of weak-instrument bias. Moreover, the observed effect size was modest, indicating that the clinical relevance of smoking-related NBL1 alterations may be limited despite their potential biological significance. Finally, parallel testing of three smoking exposures, bidirectional MR designs, and neuroblastoma validation could increase type I error risk, meaning the nominally significant association between smoking initiation and NBL1 needs external replication to avoid false positives. In addition, accessible GWAS instruments merely define binary smoking initiation, lacking genetic markers for smoking intensity, pack-years, and duration, which prevents dose–response assessment.
Future research
To resolve these limitations and outstanding research questions, future investigations are warranted, encompassing cross-ancestry MR replication, in vitro functional assays validating smoke-induced transcriptional repression of NBL1, MR analyses evaluating dose-dependent smoking effects, prospective pediatric cohort studies monitoring smoke exposure and circulating NBL1 concentrations, and multi-omics research to uncover the relevant biological mechanisms.
CONCLUSIONS
This MR study provides genetic evidence that smoking initiation is associated with reduced NBL1 expression, whereas maternal smoking around birth and household smoking exposure showed no causal relationship with NBL1. Importantly, these findings do not support a role for smoking-related NBL1 dysregulation in the development of neuroblastoma. Instead, smoking-induced suppression of NBL1 may have greater relevance to the pathogenesis of adult malignancies.