

INTRODUCTION
Amyotrophic lateral sclerosis (ALS) is a debilitating neurodegenerative disorder that primarily affects the voluntary motor nervous system. It is characterized by a progressive weakening and spasticity of the affected regions, with symptoms gradually spreading from the initial site(s) of onset1. Given the absence of effective therapeutic interventions for ALS and its substantial impact on individuals and society, addressing this condition is an urgent global concern2,3.
Both genetic and environmental factors have been identified as contributors to the risk of developing ALS. In terms of genetic risk factors, several genes, namely SOD1, FUS, TDP43, and C9orf72, have been associated with the occurrence of ALS4-6. As for environmental factors, various factors such as mercury, lead, pesticides, solvents, head trauma, electric shock, and lower body mass index have been suggested as potential risk factors for ALS7.
While smoking is a significant risk factor for various diseases and is well-established as the primary preventable cause of death, the relationship between smoking and ALS has been studied extensively, with varying and inconclusive findings in the existing literature. While some previous studies have indicated a weak positive relationship between smoking and ALS, others have found no significant association7,8,9.
As such, there is a clear demand for comprehensive investigations, including meta-analyses, to establish a dose-response relationship and gain a more thorough comprehension of the potential causal link between smoking and ALS. Therefore, our objective was to examine the association between smoking and ALS by conducting systematic reviews and dose-response meta-analyses of relevant observational studies.
METHODS
Protocol and registration
The protocol of this study was registered in PROSPERO and conducted in accordance with the methods described in the preferred reporting items for systematic reviews and meta-analyses (PRISMA) guidelines10,11.
Information source and search strategy
On 16 January 2023, a systematic literature search was performed using various medical databases such as Medline, Embase, Web of Science, Scopus, and ScienceDirect to identify relevant published articles. In order to establish search strategies for each database, the primary focus was placed on utilizing the MeSH term and entry terms for: ‘smoking’, ‘amyotrophic lateral sclerosis’, ‘case-control study’, and ‘cohort study’. The final search strategies, which are detailed in Supplementary file Table 1 with a comprehensive description of the search techniques used for each database, were determined by consensus among all the authors. The articles that were incorporated in the previous meta-analyses were also obtained by conducting a bibliographic search of the references cited within the articles7,12. Google and Google Scholar were utilized for a search of grey literature, and the reference lists of pertinent publications were scrutinized to ascertain the inclusion of any missing records.
Table 1
Characteristics of included studies*
Eligibility criteria
The PICO framework utilized in this study for the precise collection of relevant evidence is as follows:
P (Population): People of any gender, age, or ethnicity, with available information regarding their smoking status and diagnosis of ALS, were included without any restrictions.
I (Intervention): Smokers (current smokers and former smokers).
C (Comparison): Non-smokers.
O (Outcome): Odds ratio of ALS in smokers compared to non-smokers.
We selected case-control and cohort studies that included information for smoking and onset of ALS. In case of data source duplication, only articles with the largest sample size were selected. Studies that did not clearly define the control group were excluded. For case-control study selection, only those studies were included where potential confounding factors, such as sex and age, were matched. Motor neuron diseases other than ALS, such as primary lateral sclerosis, progressive bulbar palsy, and spinal muscular atrophy, were excluded from the analysis. Animal and in vitro studies, as well as review articles, cross-sectional studies, case series, abstracts, and case reports, were excluded from the analysis. There were no restrictions imposed by the study on the age of the patients, the language used, or the year of publication.
Study selection
The corresponding author conducted a review of the initial records extracted from the search database to assess their relevance and validity. The first authors independently performed both initial screening and full-text review, and also conducted a bibliographic review of the included studies. The eligibility of the case-control and cohort studies included in previous meta-analyses was also reassessed for inclusion12,13. The grey literature search was also conducted by the first authors. Any discrepancies with regard to the inclusion of articles were resolved through discussion among all authors.
Data extraction
The information from the included studies was extracted independently by the first authors through a full-text review. The types of information included the first author’s name, publication year, location, age of participants, number of participants, period of recruitment, diagnostic criteria, smoking status, and matched variables.
Assessment of risk of bias
The potential risk of bias in the cohort and case-control studies that were included was evaluated by utilizing the Newcastle-Ottawa Scale, which is among the most commonly utilized instruments for determining risk of bias in observational research13. The comprehensive assessment was conducted using three domains (selection, comparability, and outcome) consisting of eight items and rated as ‘good’, ‘fair’, or ‘poor’ quality. The first authors carried out the assessments independently, and then the corresponding author reviewed them. In case of any disagreements in the evaluations, the authors resolved them through discussions.
Effect measures
Unadjusted (ORs) and adjusted odds ratios (AORs) with 95% confidence intervals (CIs) were extracted in the included studies. If the odds ratio was not reported, it was calculated using the 2×2 contingency table. For cohort studies reporting relative risk, the Zhang and Yu17 method was used to convert it to an OR.
Data synthesis and subgroup analyses
We assessed the heterogeneity of pooled effect measures using the I2 statistic classification proposed by Higgins et al.15. If the heterogeneity of the integrated results was <50%, it was considered low, and if ≥50% it was considered considerable heterogeneity. To obtain a pooled odds ratio for categorical data, we utilized the inverse variance method. We employed a random-effects model regardless of heterogeneity to accommodate the varying study designs included in the analysis. The meta-analysis was performed using Review Manager 5.4, a software program developed by Cochrane, and visualized the pooled odds ratios using forest plots. Subgroup analyses were conducted for several factors, including sex, study design (case-control, and cohort), and current smokers.
Dose-response analysis
To perform a dose-response analysis between smoking and ALS, we used restricted cubic-spline analysis for studies containing available pack-years information on smoking16. To evaluate linearity in the dose-response relationship, a Wald test was conducted on three dose categories across four notes (5, 35, 65, 95 percentile) by segmenting smoking (pack-years). A dose-response graph was generated using the STATA 13 software to visually represent the association
Publication bias
Funnel plots were utilized to quantitatively evaluate the possibility of publication bias, generated through the STATA 13 program. Egger’s regression test, executed with the STATA 13 software, was employed to determine the statistical significance of any detected publication bias.
Certainty assessment
Grading of recommendations, assessment, development, and evaluations (GRADE) methodology was employed to evaluate the certainty of evidence for the primary outcome, which categorizes the quality of evidence as high, moderate, low, or very low, based on five essential domains (study limitations, directness, consistency, precision, and reporting bias) as well as three supplementary domains (dose-response relationship, plausible confounding factors that could decrease the observed effect, and strength of association)17,18.
RESULTS
Study selection process
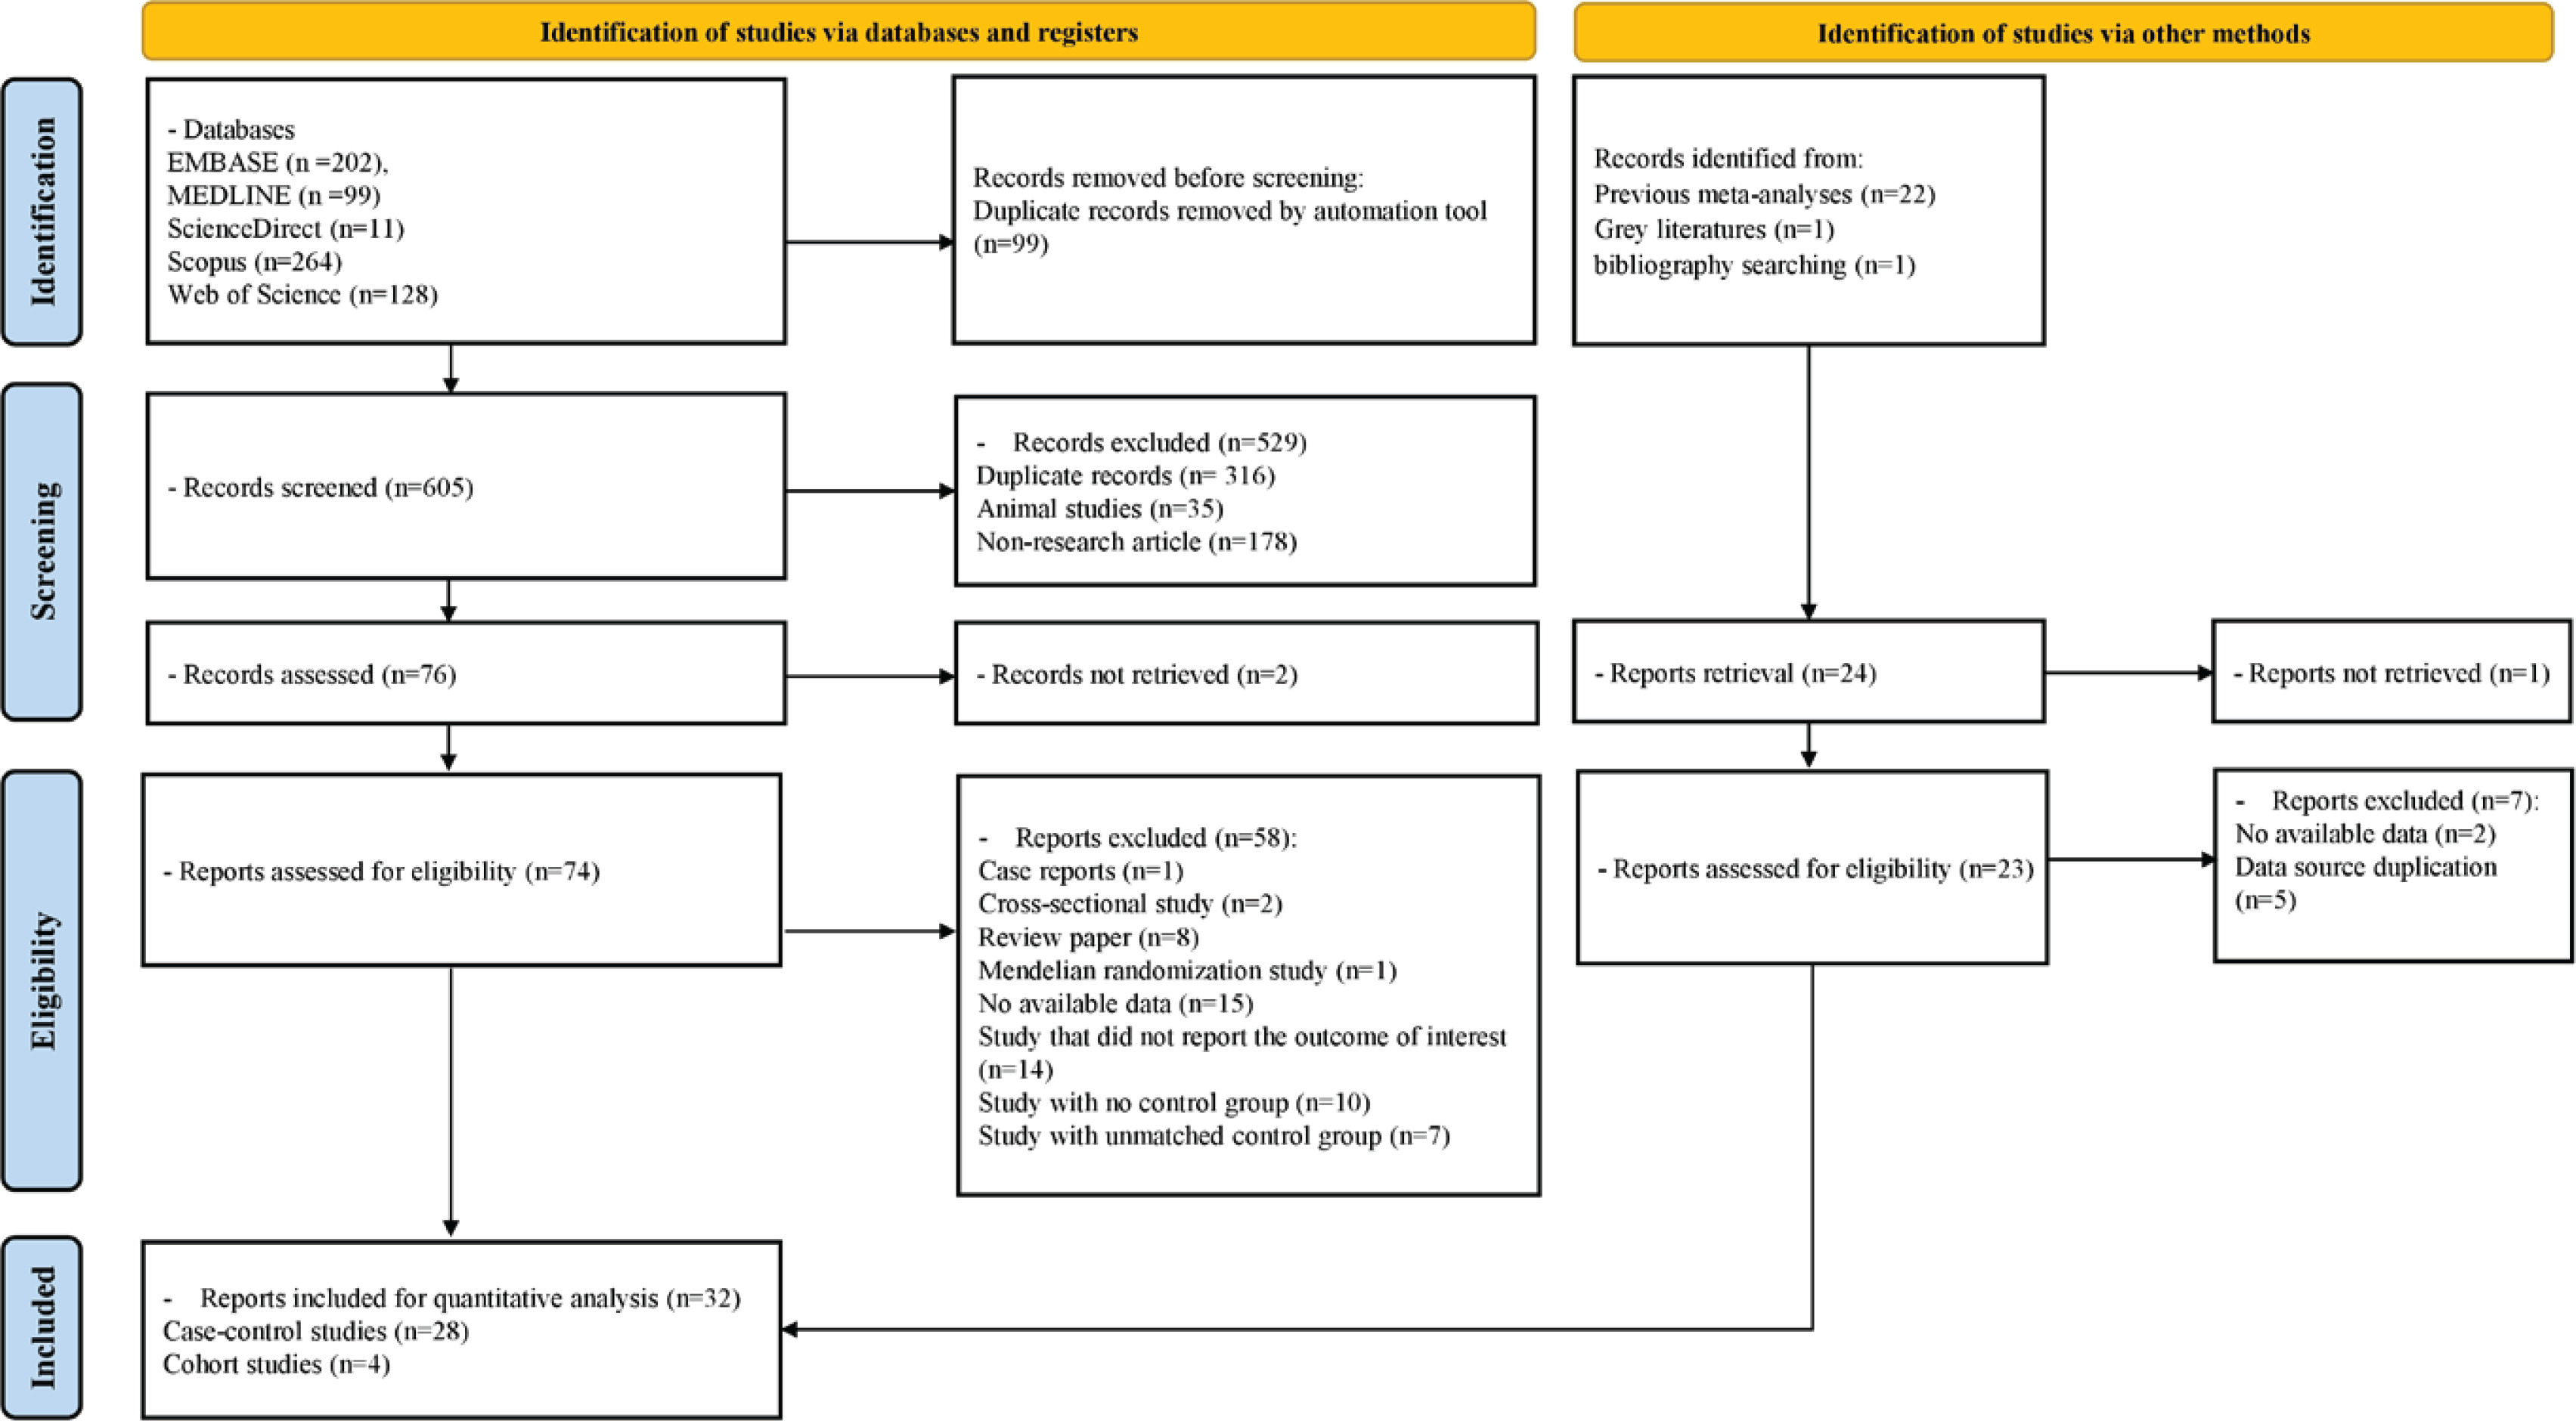
A search was conducted in five databases using a predefined search strategy. A total of 605 records were screened after removing 99 duplicate records using deduplication tools within the databases. Of these, 314 duplicate records, 35 animal studies, and 178 non-research articles were excluded, leaving 78 records for initial screening. Two records could not be retrieved, and 76 articles underwent full-text review. In addition, 23 articles were identified through grey literature searching, bibliography reviews, and review of studies included in previous meta-analyses. Finally, 32 studies, including 28 case-control studies and four cohort studies, were selected for systematic review and meta-analysis. Other articles were excluded if they were review articles, Mendelian randomization studies, case reports, cross-sectional studies, or they lacked available data, failure to report the outcome of interest, and lack of a control group or unmatched control group. The excluded studies are presented in Supplementary file Table 5, along with their respective reasons. A PRISMA diagram that outlines the process of selecting studies for inclusion is presented in Figure 1.
Characteristics of included studies
A total of 32 studies, between 1981 and 2022, were included in the analysis. Many of the studies were conducted in the United States and Europe, with only a small number conducted in Japan and China. The diagnostic criteria used for ALS diagnosis in most studies were either the El Escorial Criteria or the revised El Escorial Criteria. All case-control studies were age and sex matched. In cohort studies, ALS confirmation was done through national registries, and the follow-up period ranged from 7 to 28 years. The characteristics of the included studies are summarized in Table 1 (the corresponding full references of the articles are given in Supplementary file Table 4).
The pooled odds ratio of smoking and ALS
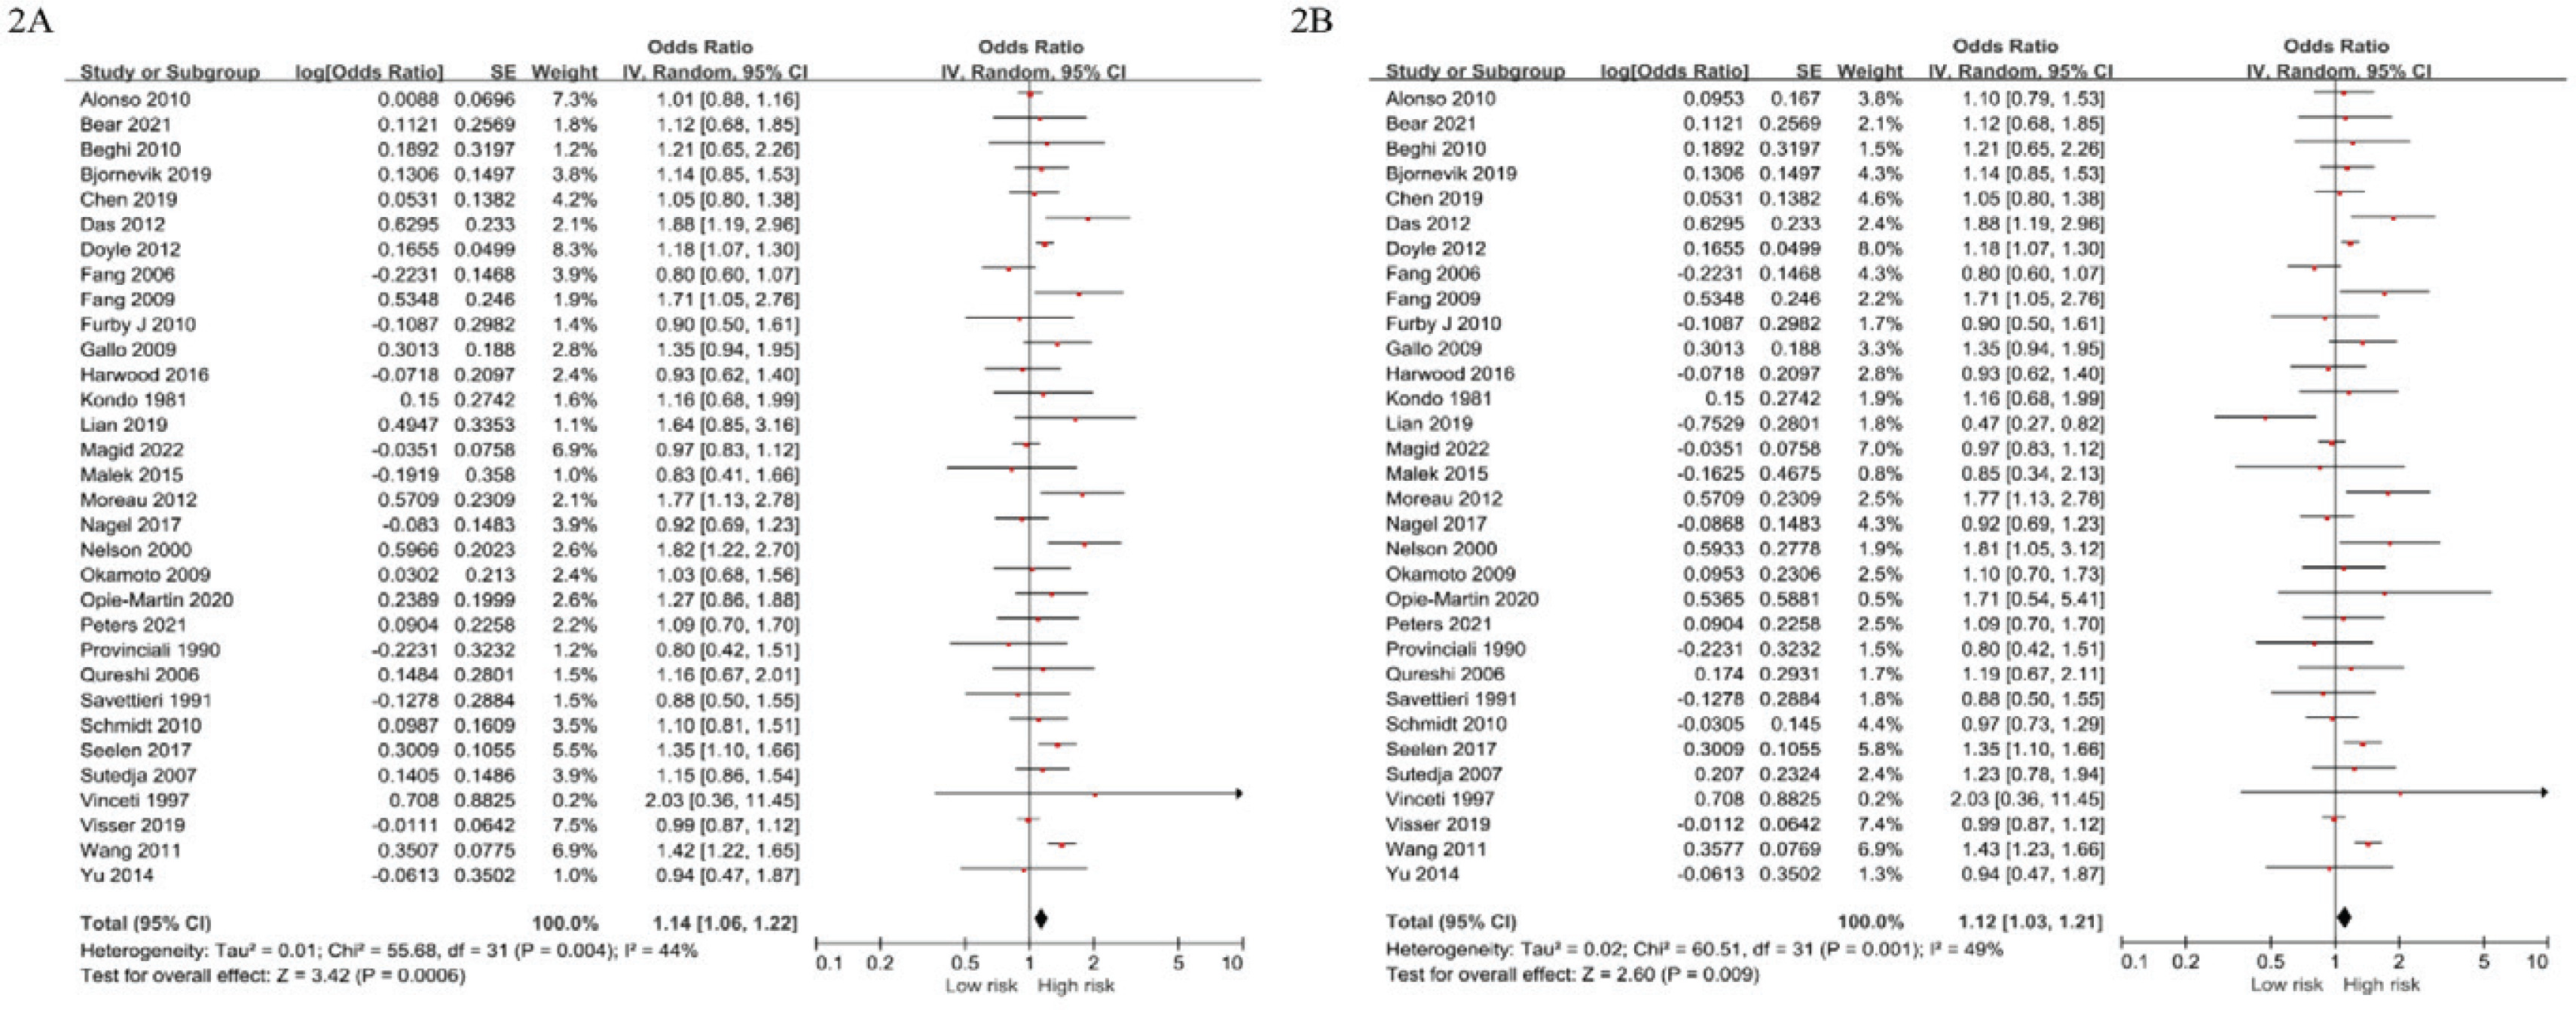
The present meta-analysis included 32 studies comprising 28 case-control studies and 4 cohort studies, from which the pooled OR of smoking and ALS was derived. The unadjusted OR was 1.14 (95% CI: 1.06–1.22, I2=44%, p<0.001), and the adjusted OR (AOR) was 1.12 (95% CI: 1.03–1.21, I2=49%, p=0.009) (Figure 2).
Figure 2
Forest plot of pooled odds ratios for the risk of amyotrophic lateral sclerosis in smoking group compared to the control group (2A: unadjusted, 2B: adjusted)
Additionally, the pooled OR between current smoking and ALS was derived from 22 studies, with an unadjusted OR of 1.28 (95% CI: 1.10–1.49, I2=66%, p<0.001) and an adjusted OR of 1.28 (95% CI: 1.10–1.48, I2=58%, p=0.001). Subgroup analysis by study design showed that the pooled OR of cohort studies was unadjusted 1.18 (95% CI: 0.96–1.44, I2=77%, p=0.11) and adjusted 1.18 (0.96-1.44, I2=77%, p=0.11), while that of case-control studies was unadjusted 1.12 (95% CI: 1.03–1.21, I2=28%, p=0.005) and adjusted 1.10 (95% CI: 1.00–1.20, I2=34%, p=0.05). Furthermore, subgroup analysis by sex revealed an unadjusted OR of 1.02 (95% CI: 0.85–1.22, I2=49%, p=0.84) and AOR of 1.01 (95% CI: 0.80–1.28, I2=58%, p=0.93) for men, whereas an unadjusted OR of 1.20 (95% CI: 1.10–1.30, I2=0%, p<0.001) and AOR of 1.25 (95% CI: 1.11–1.42, I2=11%, p<0.001) for women. The main and subgroup analysis results are presented in Table 2.
Table 2
Association between smoking and amyotrophic lateral sclerosis through main and subgroup analyses of included studies
The subgroup difference In AOR based on sex (men, women) gave p=0.11, indicating no significant difference between these groups. In contrast, the subgroup difference in AOR based on study design (cohort, case-control) gave p=0.01, signifying a significant difference between these groups.
Dose-response analysis between smoking (pack-years) and ALS
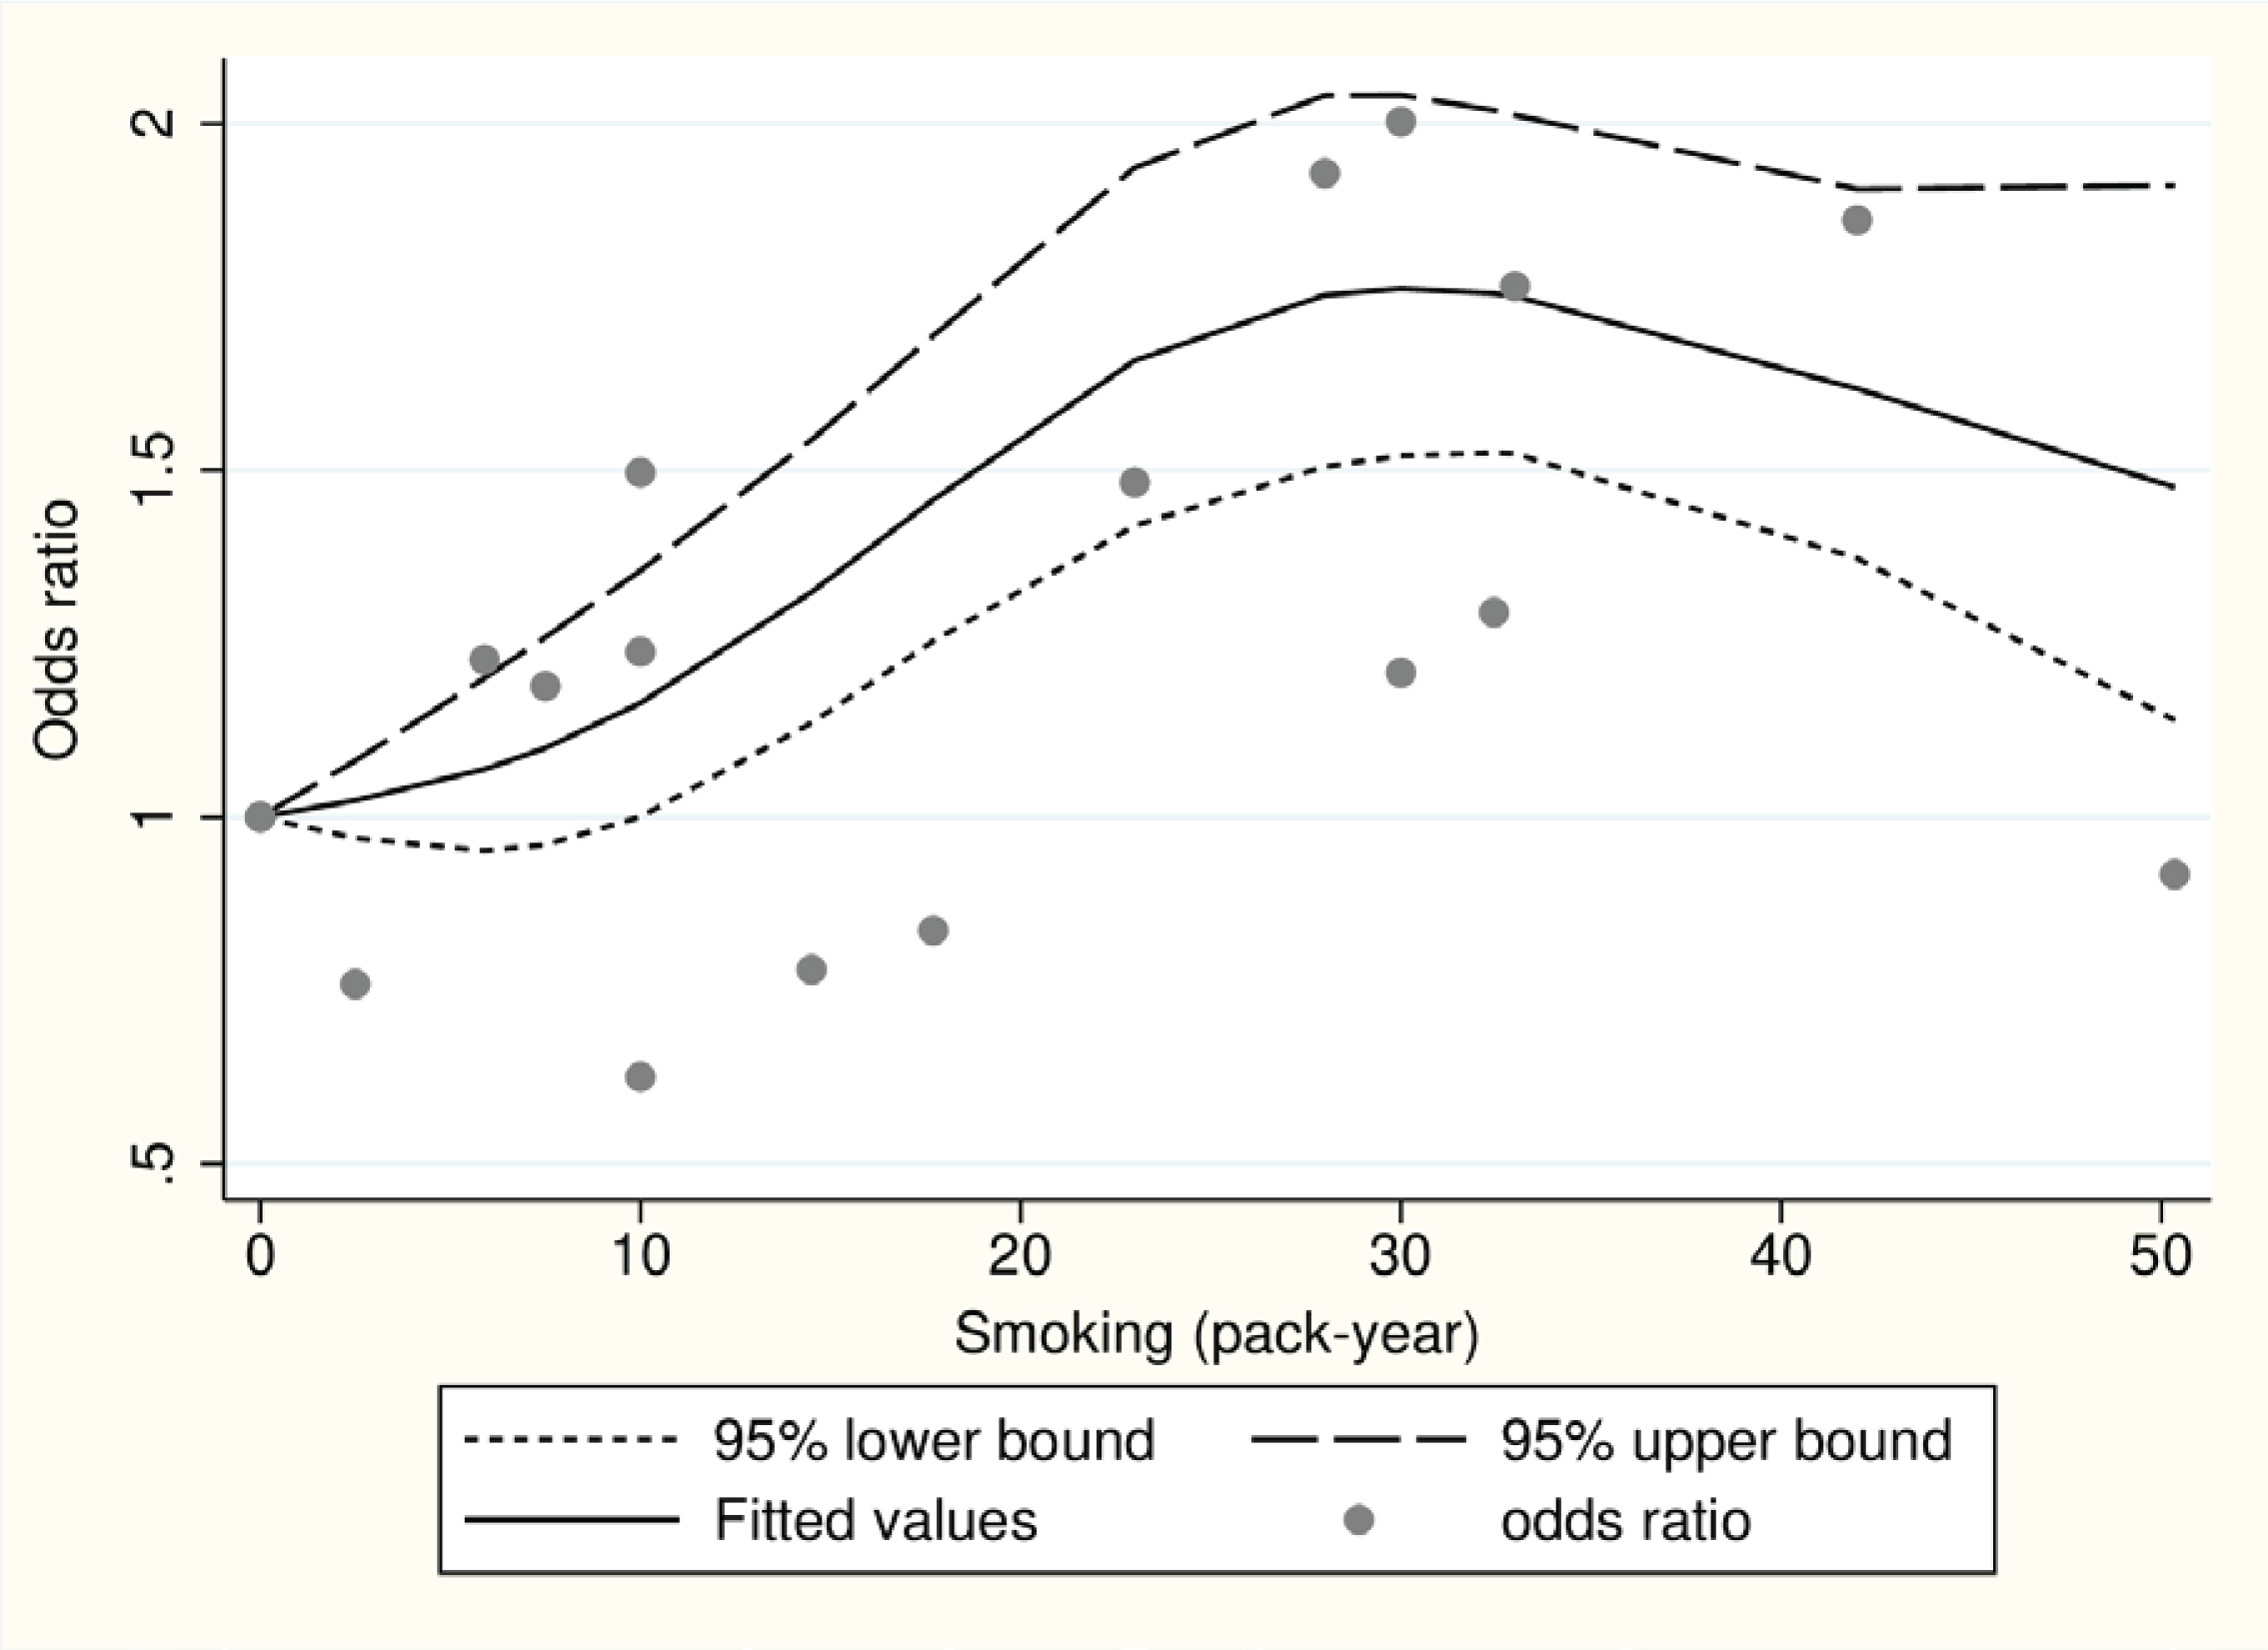
We performed a dose-response analysis on five studies (two cohort and three case-control) that provided pack-years information of smoking. We used the Wald test to assess linearity, which yielded a significant p=0.005. As a result, the assumption of linearity was rejected, suggesting that a non-linear model may be more suitable for predicting dose-response relationships. Figure 3 illustrates the dose-response graphs for non-linear models, indicating an inverted U-shaped curve.
Risk of bias within studies
Among 28 case-control studies, 8 were rated as ‘good’ and 20 as ‘poor’. Of the 4 cohort studies, 2 were rated as ‘good’ and 2 as ‘fair’. The prevalent rating of ‘poor’ among the case-control studies is attributed to the fact that the assessment of exposure was not based on medical records or blinded interviews, and the response rate was either not mentioned or inconsistent between case and control group. A detailed evaluation of risk of bias is shown in Supplementary file Tables 2 and 3.
Table 3
GRADE approach for certainty assessment of overall analysis between smoking and amyotrophic lateral sclerosis
| Outcomes | Certainty assessment | Effect | Certainty | ||||||
|---|---|---|---|---|---|---|---|---|---|
| Number of studies | Study design | Inconsistency | Indirectness | Imprecision | Publication bias | Other considerations | OR (95% CI) | ||
| Smoking – ALS | 32 | Serious* | Not serious** | Not serious | Not serious*** | Not serious**** | Dose-response gradient, residual confounding, or biases | 1.14 (1.06–1.22) | Low |
Publication bias
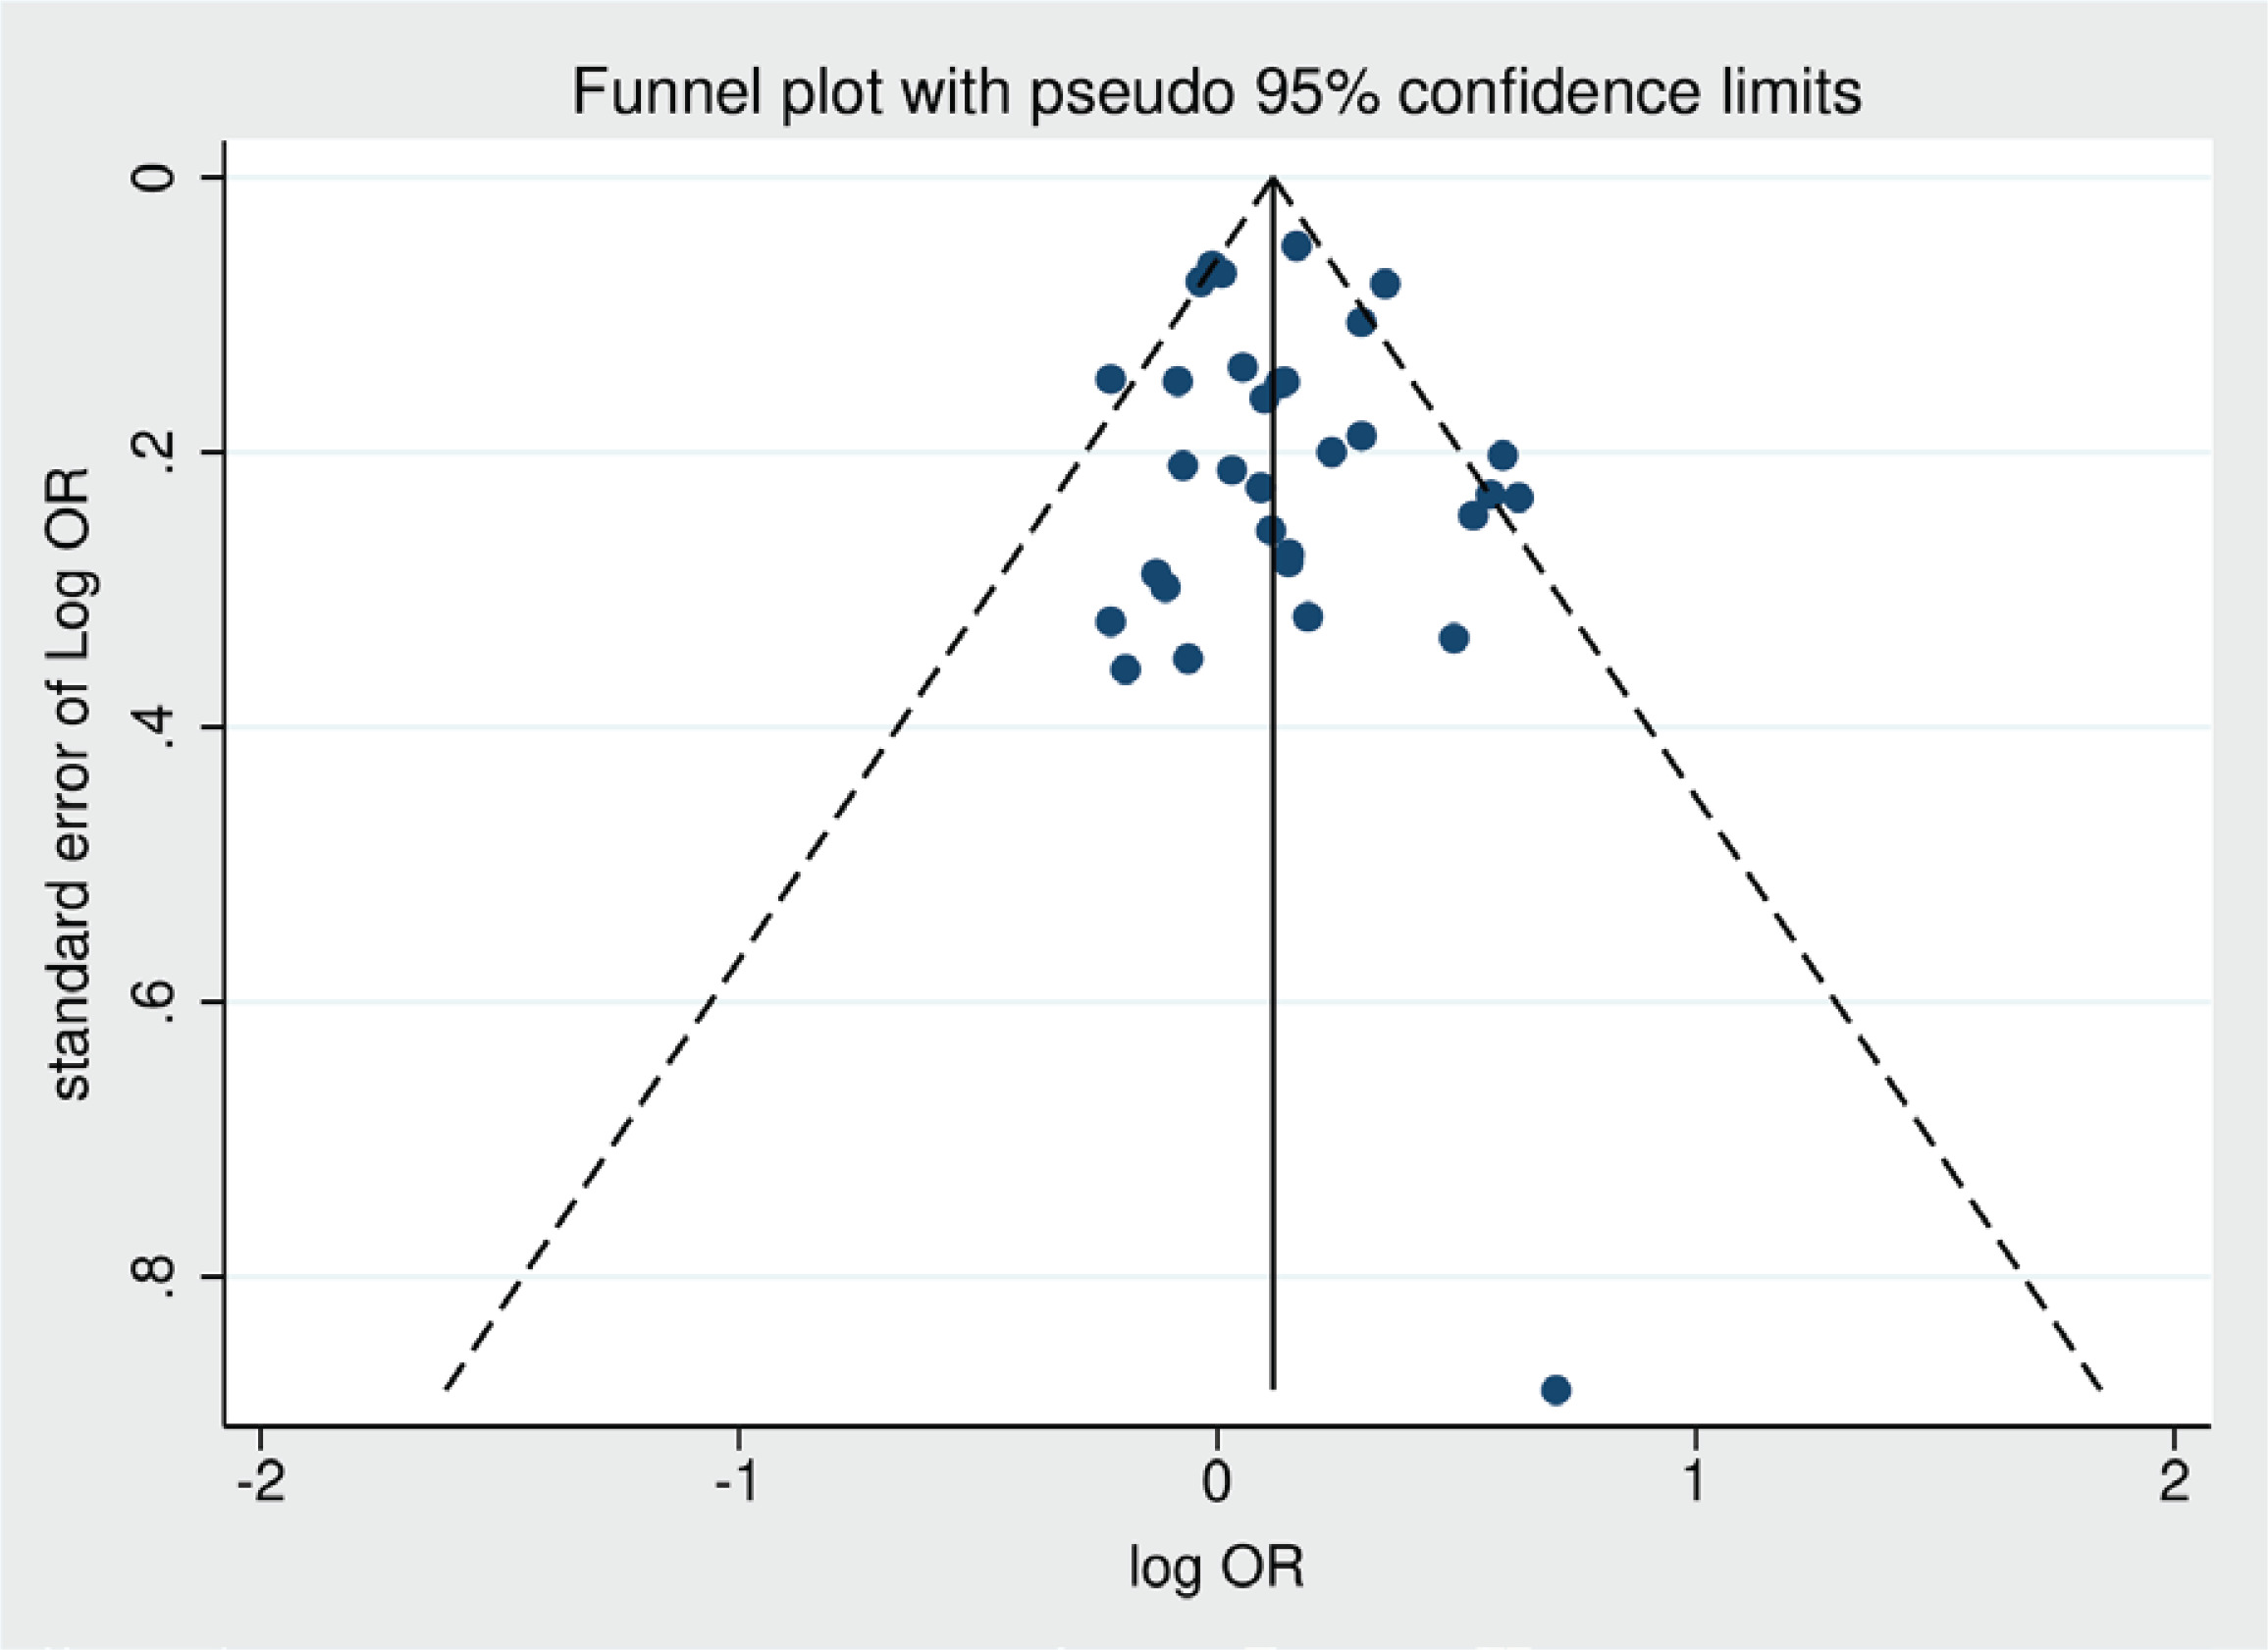
Funnel plot was drawn to evaluate potential publication bias in the unadjusted OR results for smoking and ALS (Figure 4). The funnel plot did not reveal any significant publication bias. Additionally, Egge’s regression test was conducted and demonstrated no significant publication bias (p=0.504).
Certainty assessment
A comprehensive evaluation of eight domains was conducted to assess the strength. To determine the strength of the primary outcome, a thorough assessment of eight domains was performed. The GRADE approach was utilized to evaluate the quality of evidence for the primary outcome, which was rated as low. A detailed evaluation of each domain is shown in Table 3.
DISCUSSION
The primary finding of this study indicates a significant association between smoking and an increased risk of ALS, particularly in a dose-dependent manner. Previous studies have yielded inconsistent results regarding the relationship between smoking and ALS risk19-22. For instance, the Swedish Construction Workers Cohort, which involved 280558 male construction workers, did not find any evidence supporting an elevated risk of ALS associated with smoking19. A prior case-control study conducted in New England reported a weak association between smoking and ALS risk, but did not establish a dose-response relationship. Conversely, the European Prospective Investigation into Cancer and Nutrition (EPIC) cohort study, which examined mortality rates from ALS across different age groups, revealed that individuals who smoked for more than 33 years had a more than two-fold increased risk of developing ALS compared to those who never smoked8. The disparate findings among previous studies may be attributed to variations in study design, sample size, population characteristics, and methods employed to assess smoking exposure and ALS risk. The meta-analysis conducted by Alonso et al.12 does not offer strong support for a significant relationship between smoking and ALS risk, but rather hints at a possible association between smoking and an elevated risk of ALS in women. The inclusion of multiple studies and the utilization of a meta-analysis approach in our study address some of these limitations, resulting in a more comprehensive evaluation of the association. Our meta-analysis confirms the association between smoking and ALS risk. Furthermore, the dose-response curve exhibits an inverted U-shape. There is a limited number of studies conducted in the higher pack-years ranges of smoking, and this is believed to be influenced significantly by the single study results from Schmidt8, which show a low OR on the dose-response curve. It is anticipated that the statistical explanatory power of the dose-response relationship may be further strengthened as more studies accumulate in the future.
In our current analysis, we have identified a significant association between smoking and ALS in females, while no significant association was observed in males. Notably, a substantial proportion of ALS cases with bulbar onset were found in females, indicating that smoking may potentially act as a risk factor for bulbar ALS or contribute to an earlier onset of the disease in females22. A comprehensive analysis pooling data from cohort studies has indicated that smoking is a causal risk factor for ALS in females, and individuals with a history of smoking have a higher risk of developing ALS23. The absence of significant associations between smoking and ALS in males may be influenced by the fact that they are often more exposed to other potential risk factors for ALS, such as pesticides or organic solvents, during their occupational activities. This occupational confounding could have impacted the results in males. Therefore, further population-based studies specifically designed to investigate the causes of ALS are warranted. It is worth noting that many of the studies cited in this project were not originally designed with the specific aim of studying ALS etiology8,23.
While our study did not specifically investigate the mechanisms, we can propose hypotheses regarding the association between smoking and ALS. The association between smoking and ALS risk may be attributed to the potential impact of oxidization products from smoking on the impairment of mitochondria and endoplasmic reticulum12,24. Smoking introduces various oxidizing agents and toxic substances into the body, which can have detrimental effects on cellular components. Specifically, the oxidization products derived from smoking have been implicated in the impairment of mitochondria and endoplasmic reticulum12,25. Mitochondria are responsible for cellular energy production through oxidative phosphorylation. They play a crucial role in maintaining cellular homeostasis, including calcium regulation and reactive oxygen species (ROS) management. Oxidative stress induced by smoking can disrupt the normal functioning of mitochondria, leading to mitochondrial dysfunction. This dysfunction can result in increased ROS production, impaired energy production, and compromised cellular processes. The endoplasmic reticulum is a vital organelle involved in protein synthesis, folding, and calcium storage. Disruption of endoplasmic reticulum function can lead to the accumulation of misfolded proteins, endoplasmic reticulum stress, and activation of the unfolded protein response (UPR). The oxidizing agents present in cigarette smoke can induce endoplasmic reticulum stress, triggering the UPR and impairing the endoplasmic reticulum’s ability to properly fold and process proteins. These cellular dysfunctions, including mitochondrial dysfunction and endoplasmic reticulum stress, can initiate a cascade of events, including oxidative damage, inflammation, and neuronal death, which are hallmark features of ALS pathology24. While these proposed mechanisms provide a plausible explanation for the association between smoking and ALS, further research is necessary to fully elucidate the underlying molecular pathways and confirm these hypotheses.
Limitations
Our study has several limitations that should be considered. Although we successfully established a dose-response relationship between smoking and the risk of ALS, it is important to note that our findings do not provide definitive evidence of a causal relationship. It is important to note that the majority of studies included in our analysis are case-control studies, which are susceptible to biases such as selection bias and confounding bias28. These biases have the potential to distort the results. Furthermore, it is difficult to differentiate between specific subtypes of ALS, such as sporadic ALS and familial ALS. The limited availability of individual-level data in the included studies prevented us from conducting subgroup analyses based on ALS subtypes. Furthermore, while we were able to estimate dose-response curves to a certain extent through restricted cubic-spline analysis, having individual-level data would allow for the generation of more precise dose-response curves. To address these limitations and provide more robust evidence, future studies should consider prospective designs, incorporate detailed information on potential confounders, and explore specific subtypes of ALS. Such efforts will contribute to a more comprehensive understanding of the association between smoking and ALS risk.
CONCLUSIONS
Our study showed that there is a positive relationship between smoking and the risk of ALS. Furthermore, it revealed a significant association between smoking and ALS risk, particularly in women. To reduce the risk of developing ALS, it may be necessary to discontinue smoking, which is a modifiable risk factor.