INTRODUCTION
Cancer has become a leading cause of death in China in recent decades1. A number of epidemiology studies have demonstrated that most cancers are attributable to a modifiable lifestyle and environmental risk factors, among which smoking is the largest preventable one2–5. Smoking, with a long-term adverse impact on health, has taken a great toll, of about 1 million deaths per year, on China and this is expected to exceed 3 million in 20506. China is the world’s largest producer and consumer of tobacco, with a population of 1.4 billion it has more than 301 million current smokers7. Due to substantial geographical variation in smoking prevalence, the burden of smoking related cancer across provinces remains unclear. In a previous study, we reported for the first time a systematic evaluation of the number of cancer cases and deaths attributable to carcinogens in 2005 in China8. In that study, we calculated the cancer cases and deaths attributable to smoking at the national level, but not at the provincial level. It is valuable to assess the local cancer burden caused by tobacco use as province-level initiatives are at the forefront of tobacco control, as indicated in the Lortet-Tieulent et al.9 study. However, most studies estimating smoking-related cancer mortality have been at the national level, and limited studies exist at the provincial level10–13.
Here, we provide an additional systematic assessment of cancer deaths attributable to smoking at the provincial level in China in 2013, aiming to provide scientific evidence for local policy makers to take effective action in tobacco control and cancer prevention.
METHODS
Overview
We estimate the province-specific proportion of cigarette smoking-related cancer mortality using similar methods in previous reports8,10. We selected 10 cancers caused by cigarette smoking that have been classified established targets of the carcinogenicity of tobacco by the International Agency for Research on Cancer (IARC) including: cancers of mouth/pharynx/larynx, nasopharynx, lung, stomach, liver, esophagus, pancreas, colorectum, bladder, and kidney.
Cancer deaths
Data on cancer deaths in China in 2013 were based on the 255 qualified cancer registries distributed in the 31 provinces (autonomous regions and municipalities) of the annual cancer report of National Cancer Center, covering 226494490 of the population (including 114860339 males and 111634151 females) that accounted for 16.65% of the national population in 2013. In each province, cancer death rates were calculated by age group, sex, and cancer site. The death rates with sex-specific, age-specific and province-specific populations in 2013 were extrapolated to estimate the number of cancer deaths in each province. Finally, cancer death cases were calculated by summing the cases across all age groups and cancer sites in each province. This study is based on previously published data and does not include new human data that require again ethical approval and consent. The authors assume that the data source studies were conducted after ethical approval and consent, and in accordance with the Declaration of Helsinki 1975. The authors can confirm that all relevant data are included in the article and materials are available on request from the corresponding author.
Latency time and smoking prevalence
The occurrence of current cancers always reflects the past patterns of sustained smoking exposure, therefore there is a latency period between exposure and cancer. To date, no accurate studies are available to define the specific latency time between smoking and cancers. A report of World Health Organization (WHO) in 2000 suggested a latency time of 15 years14. Therefore, we used the smoking prevalence data of 1998.
Our study used a linear interpolation method to estimate provincial smoking prevalence in 1998 of data from two national surveys, in 1996 and 200215,16, based on the previous study10. In our study, smoking was identified as ‘continuous or cumulative smoking of at least one cigarette every day for 6 months or more during the lifetime’17. Accordingly, we used the overall smoking status to represent smoking exposure, irrespective of current or former smoking status, type, amount, and duration of smoking.
Relative risk
Data on relative risks (RRs) were obtained from different sources, including PubMed and China National Knowledge Infrastructure (CNKI), in Chinese or English. High-quality meta-analyses or large-scale pooled analyses from the Chinese population were given the highest priority for RRs between smoking and specific types of cancer mortality, followed by meta-analyses from Asian populations. For most cancers associated with smoking, the RRs used in our study were obtained from a large-scale pooled analysis of smoking and cancer in populations of China and South Korea18. However, RR for smoking and kidney cancer mortality in men was from a meta-analysis among the Asian population19, and RR for smoking and esophageal cancer in women was abstracted from a prospective study in Linxian, China20 (Table 1).
Table 1
Relative risks of site-specific smoking-related cancers in China 2013
| Cancer site | ICD-10 code | Studya | Design | Age (years) | RR (95% CI) | |
|---|---|---|---|---|---|---|
| Men | Women | |||||
| Mouth/larynx/ | C00-C10 | [18] | Pooled-analysis | ≥45 | 1.95 (1.51–2.5) | 1.99 (1.11–3.59) |
| Pharynx | C12-C14 | |||||
| Stomach | C15 | [18] | Pooled-analysis | ≥45 | 1.43 (1.24–1.64) | 1.14 (1.08–1.52) |
| Colorectal | C18-C20 | [18] | Pooled-analysis | ≥45 | 1.13 (0.93–1.37) | 1.40 (1.08–1.83) |
| Liver | C22 | [18] | Pooled-analysis | ≥45 | 1.35 (1.19–1.53) | 1.75 (1.05–2.84) |
| Pancreas | C25 | [18] | Pooled-analysis | ≥45 | 1.18 (0.75–1.86) | 1.65 (1.08–2.53) |
| Lung | C33-C34 | [18] | Pooled-analysis | ≥45 | 3.56 (2.45–5.16) | 3.34 (2.29–4.86) |
| Bladder | C67 | [18] | Pooled-analysis | ≥45 | 1.97 (1.26–3.06) | 1.41 (0.56–3.52) |
| Kidneyb | C64 | [19] | Meta-analysis | - | 1.11 (0.85–1.47) | 1.11 (0.85–1.47) |
| Nasopharynx | C11 | [18] | Pooled-analysis | ≥45 | 2.22 (1.42–3.49) | 2.22 (1.42–3.49) |
| Esophagus | C15 | [18] | Pooled-analysis | ≥45 | 1.54 (0.66–3.57) | - |
| [20] | Prospective study | 40–69 | - | 1.34 (1.16–1.54)c | ||
Statistical analysis
Population attributable fraction (PAF) is defined as the proportional reduction of disease incidence or mortality in a population that would occur if exposure to a risk factor is reduced to an alternative ideal exposure scenario (e.g. no tobacco use)21. PAF was calculated according to Levin’s formula, in which p represents the prevalence of exposure to the risk factor in the total population, and RR represents the relative risk of a risk factor, where:
The 95% confidence intervals (CIs) of PAF were calculated by a Delta method22, assuming that ln(RR) has a normal distribution:
Finally, the overall PAF in each province was calculated by dividing the number of estimated smoking-attributable cancer deaths by the total number of cancer deaths among persons aged ≥30 years, in each province.
RESULTS
In 2013, smoking contributed to a total of 421566 cancer deaths (19.46% of all cancer deaths) in mainland China, with 400701 of these deaths occurring in men (29.34%) and 21368 (2.67%) in women (Table 2).
Table 2
Population (N), smoking prevalence (%), cancer deaths (CD), number and proportion of smoking-attributable cancer deaths (SACD), China 2013
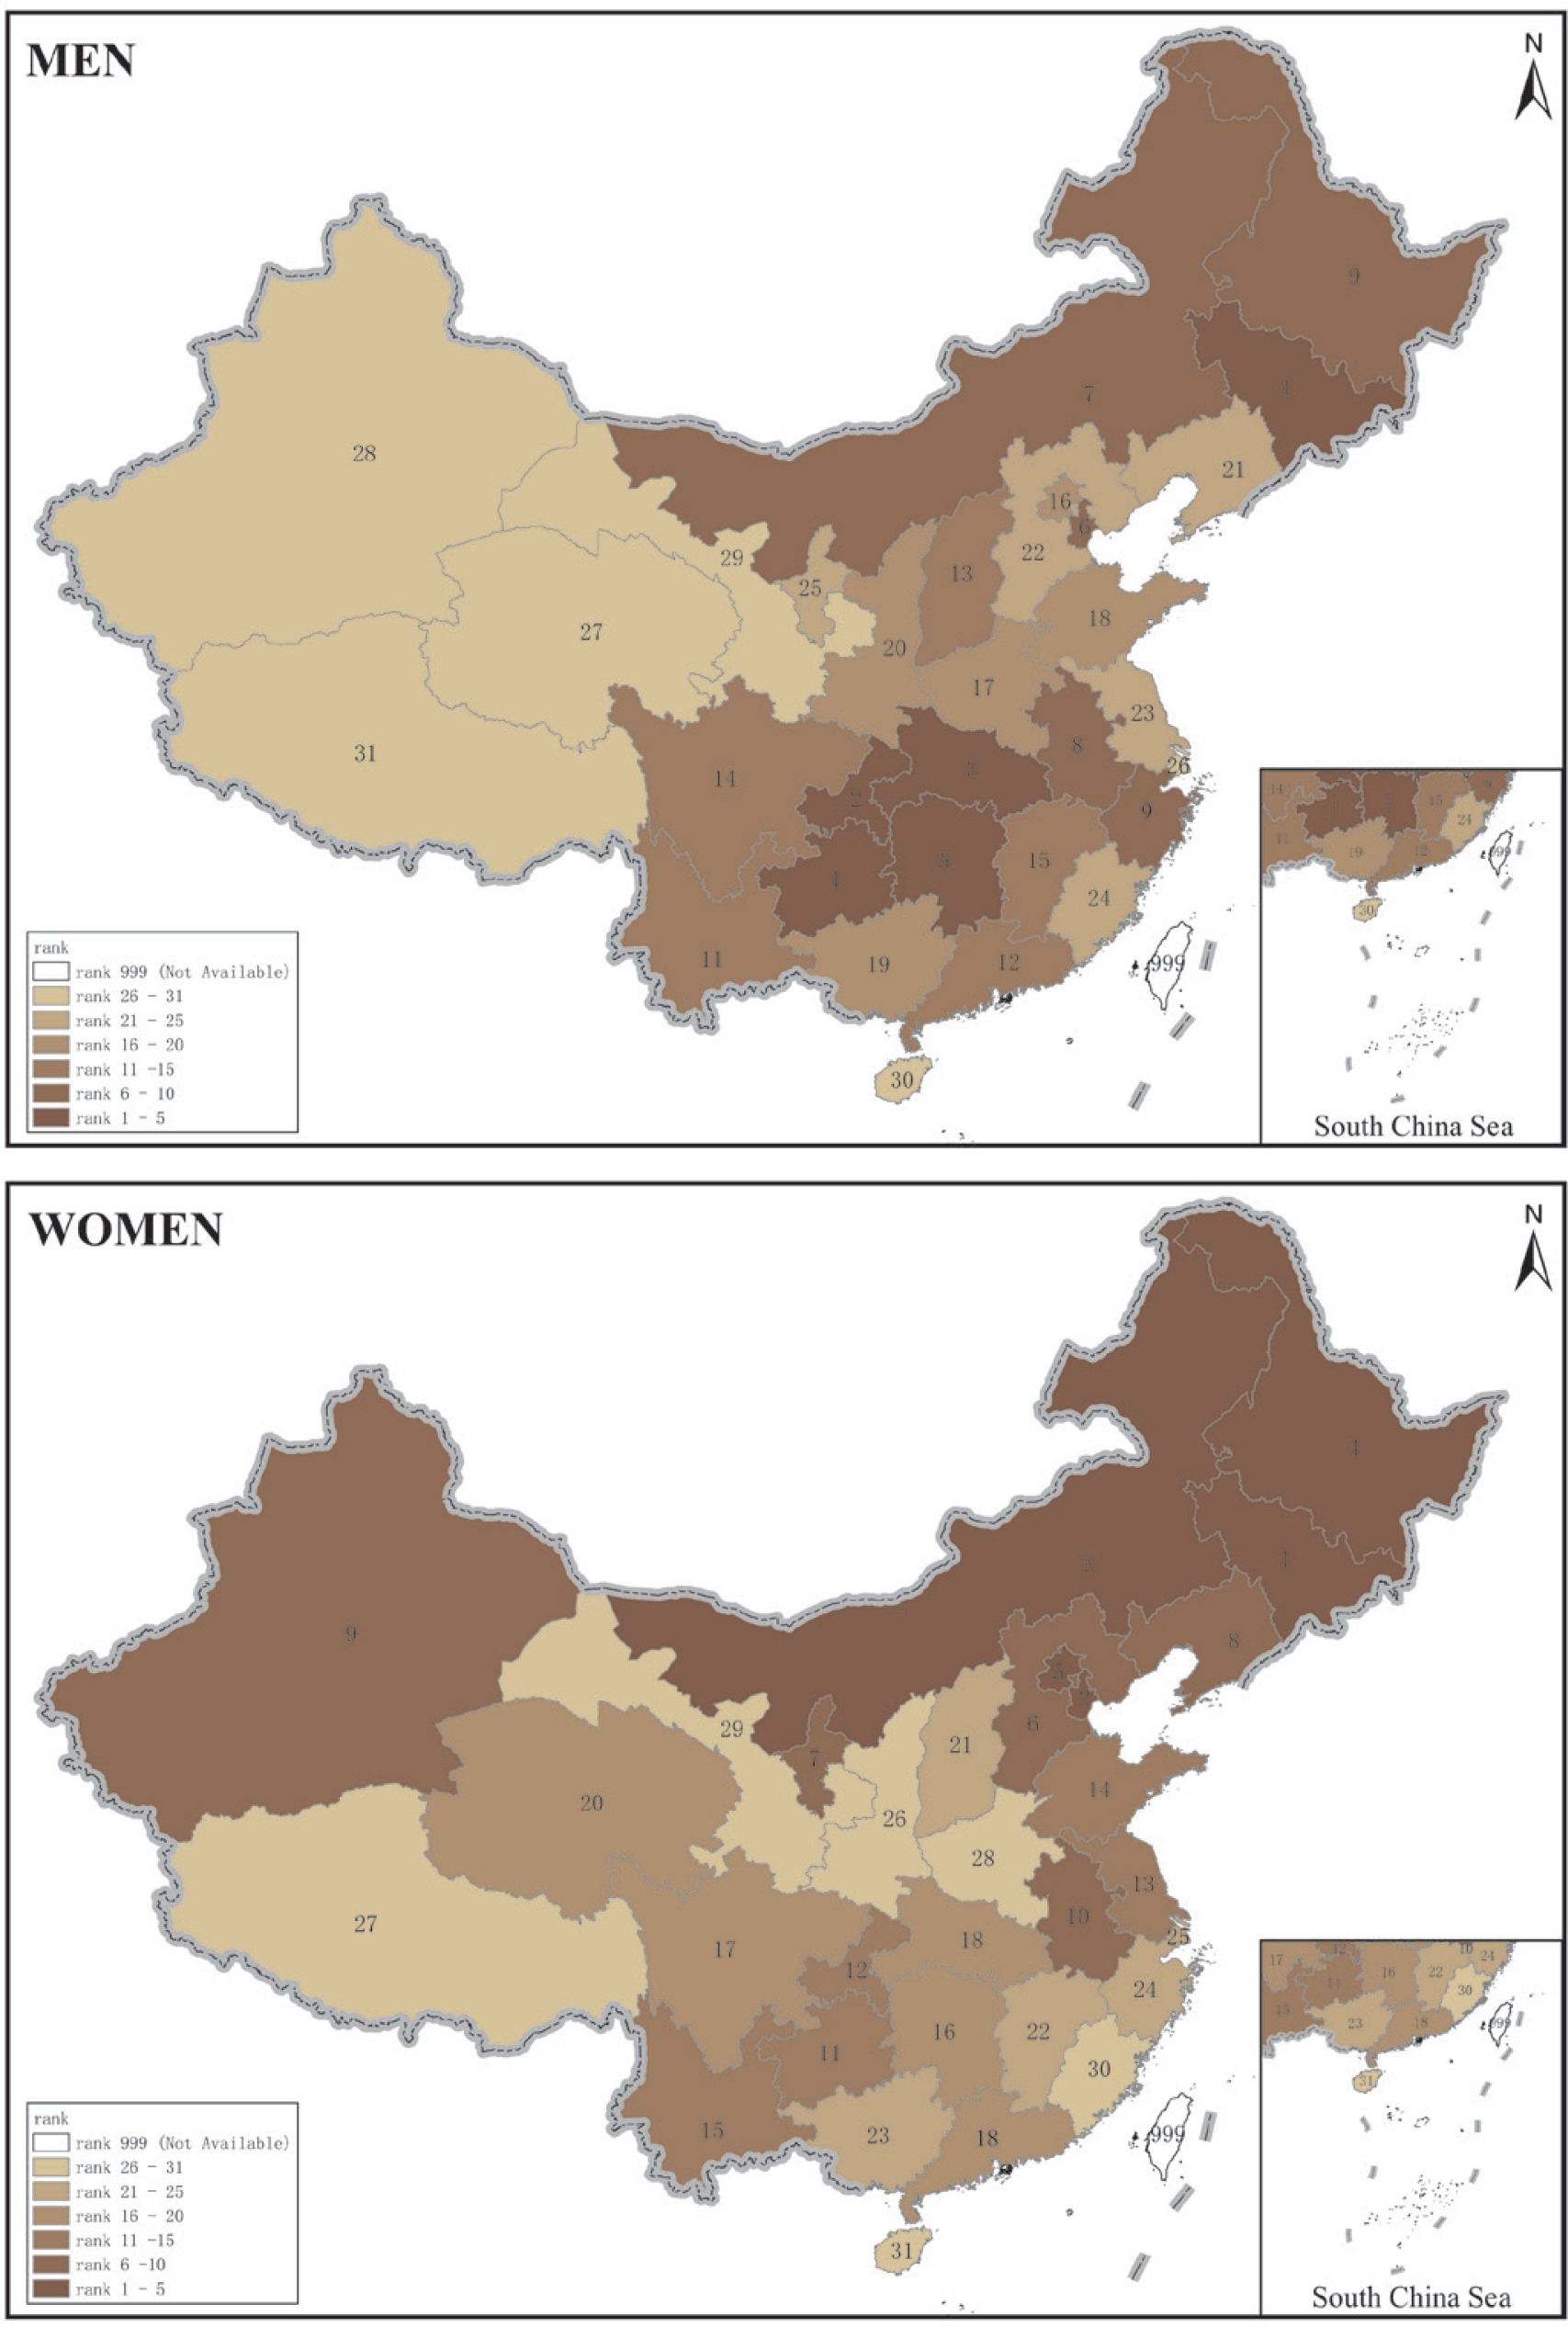
For the sexes combined, the faction of cancer deaths attributable to smoking was highest in Inner Mongolia, Chongqing, Jilin and Guizhou, and PAF ranged from 22.46% to 23.50% (Table 2; and Supplementary file, Figure S1). However, the patterns of PAFs were different between men and women, ranging from 15.56% (95% CI: 9.12–21.82%) in Tibet to 35.09% (95% CI: 25.68–45.83%) in Guizhou among men, and from 0.28% (95% CI: 0.00–0.64%) in Hainan to 10.44% (95% CI: 4.86–16.32%) in Jilin among women (Table 2). In men, the top 4 PAFs ranged from 35.09% to 31.65%, for provinces in the Southwest and Northeast regions including Guizhou, Chongqing, Hubei, and Jilin. In women, however, the topmost 4 provinces (Jilin, Tianjin, Inner Mongolia, and Heilongjiang) were located in Northern China, and PAF ranged from 8.58% to 10.44%, which was three-fold of the national average (Figure 1).
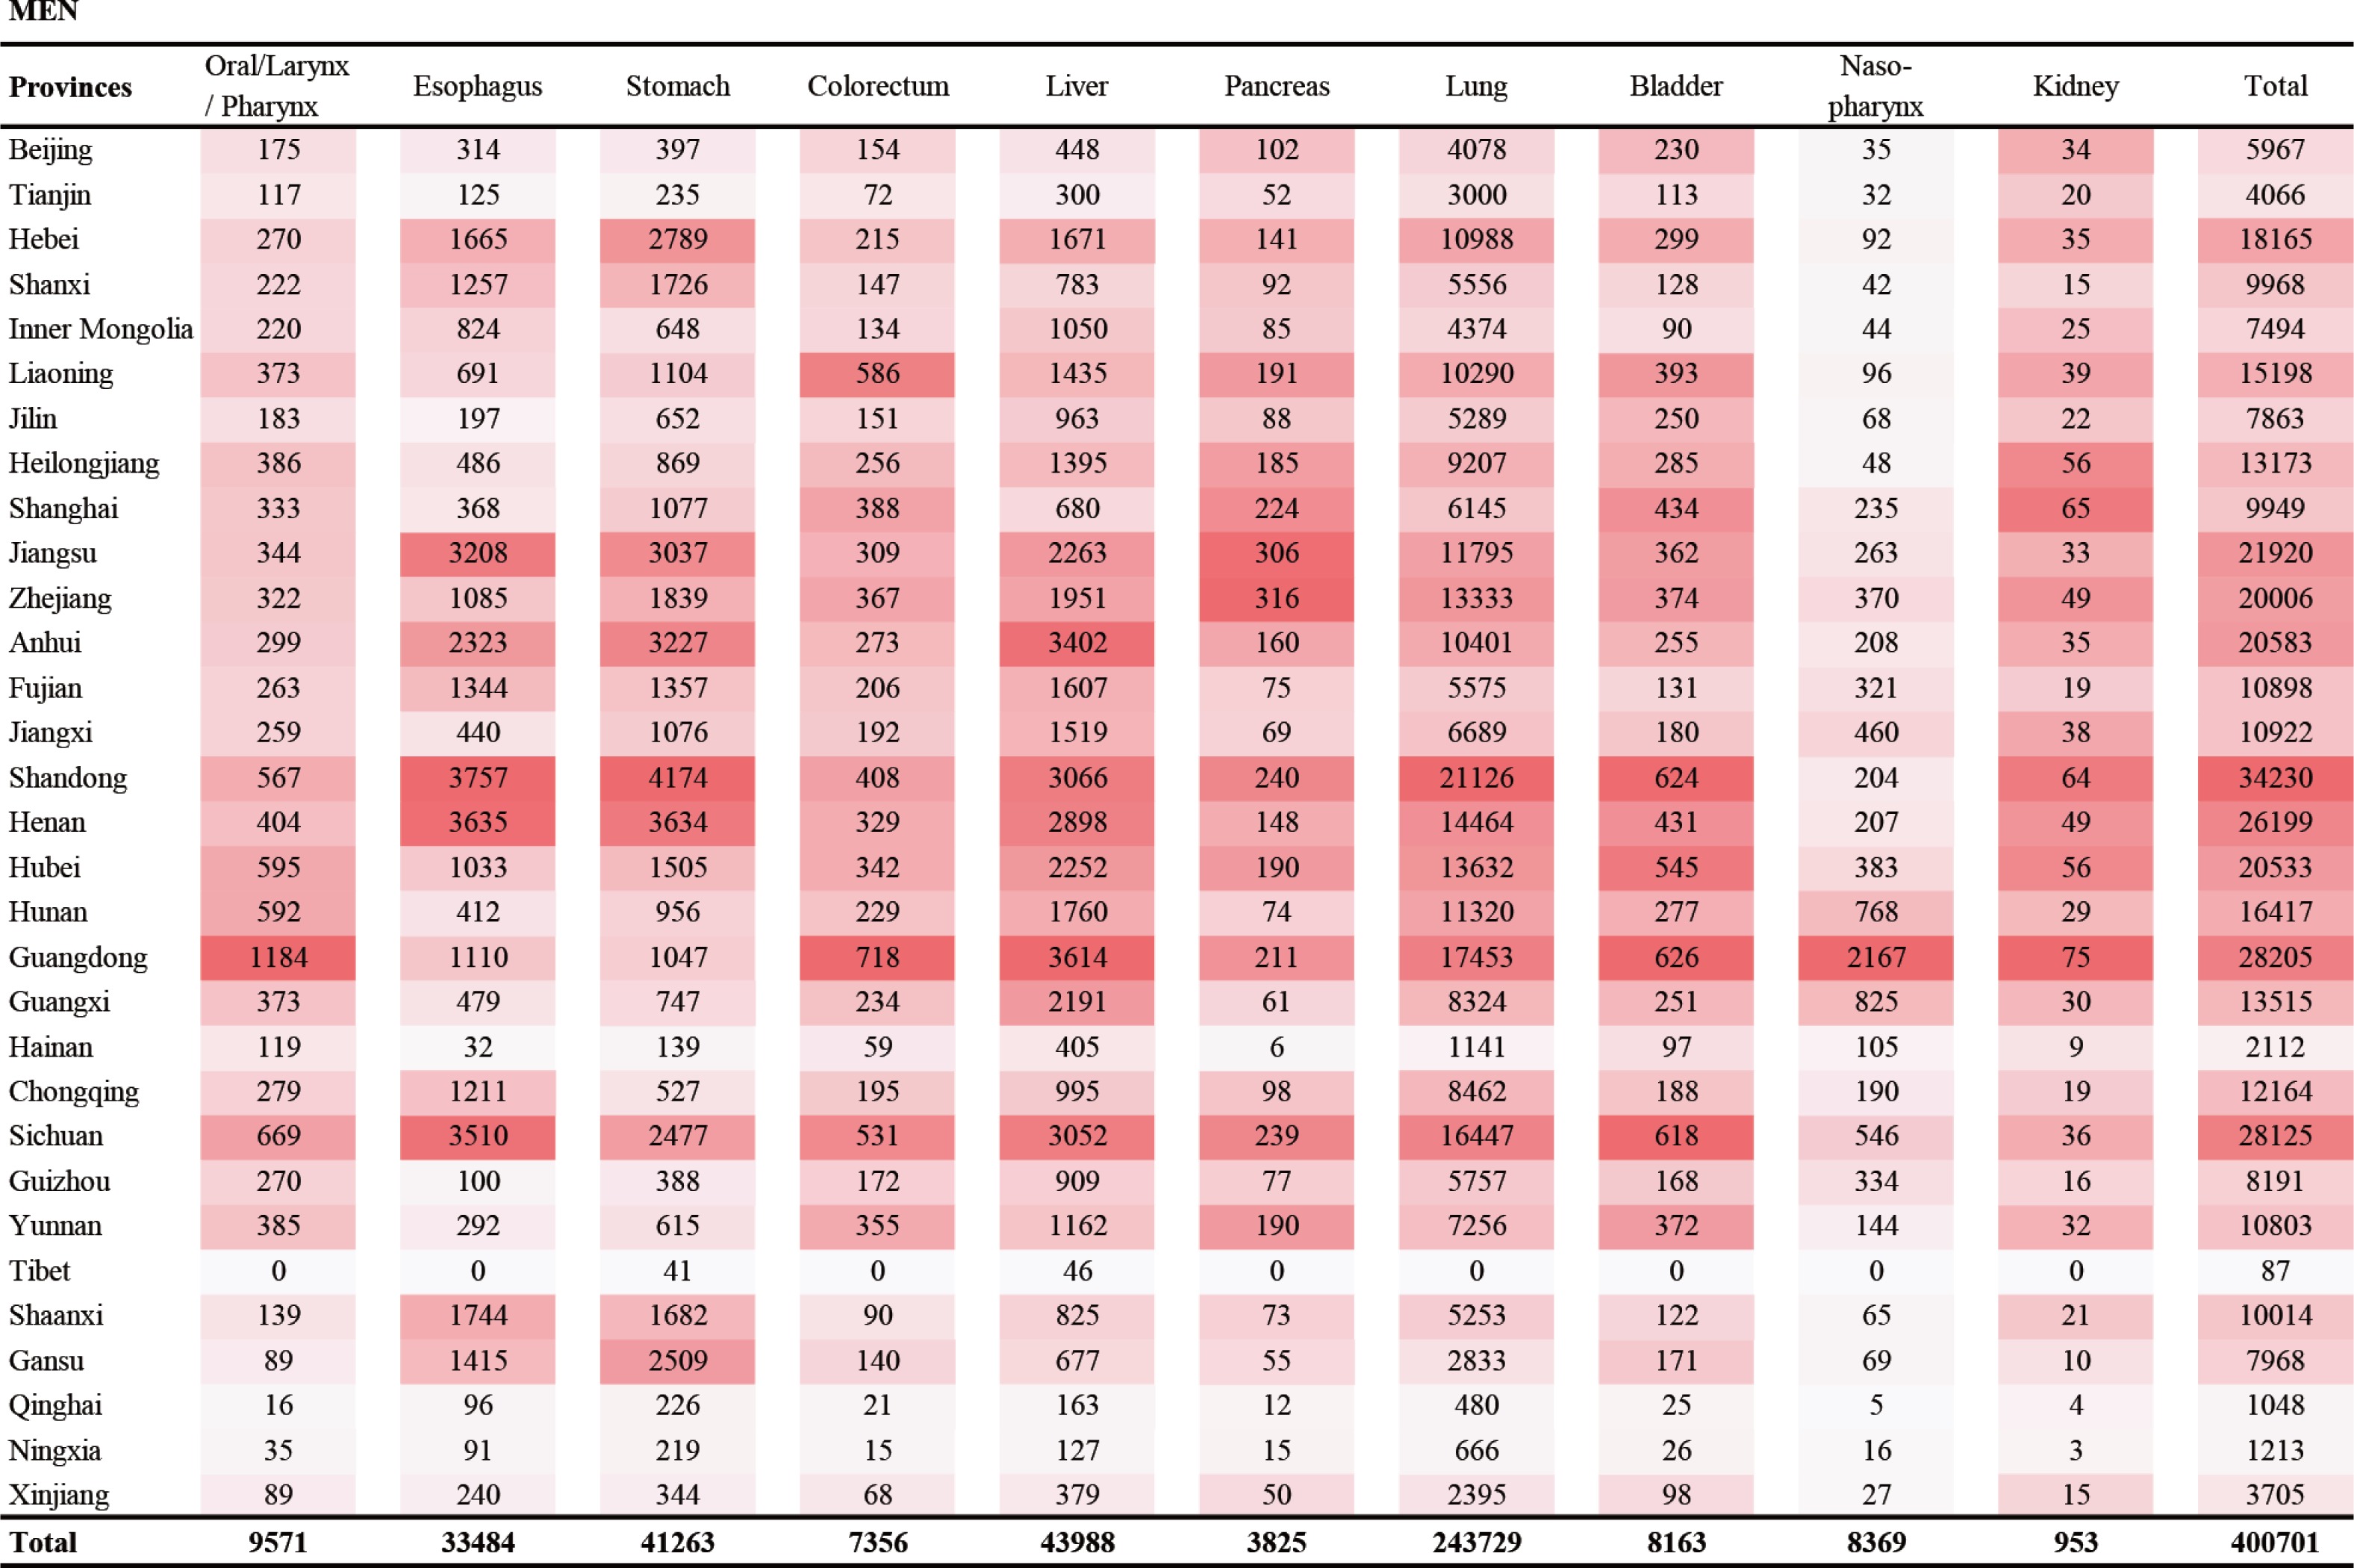
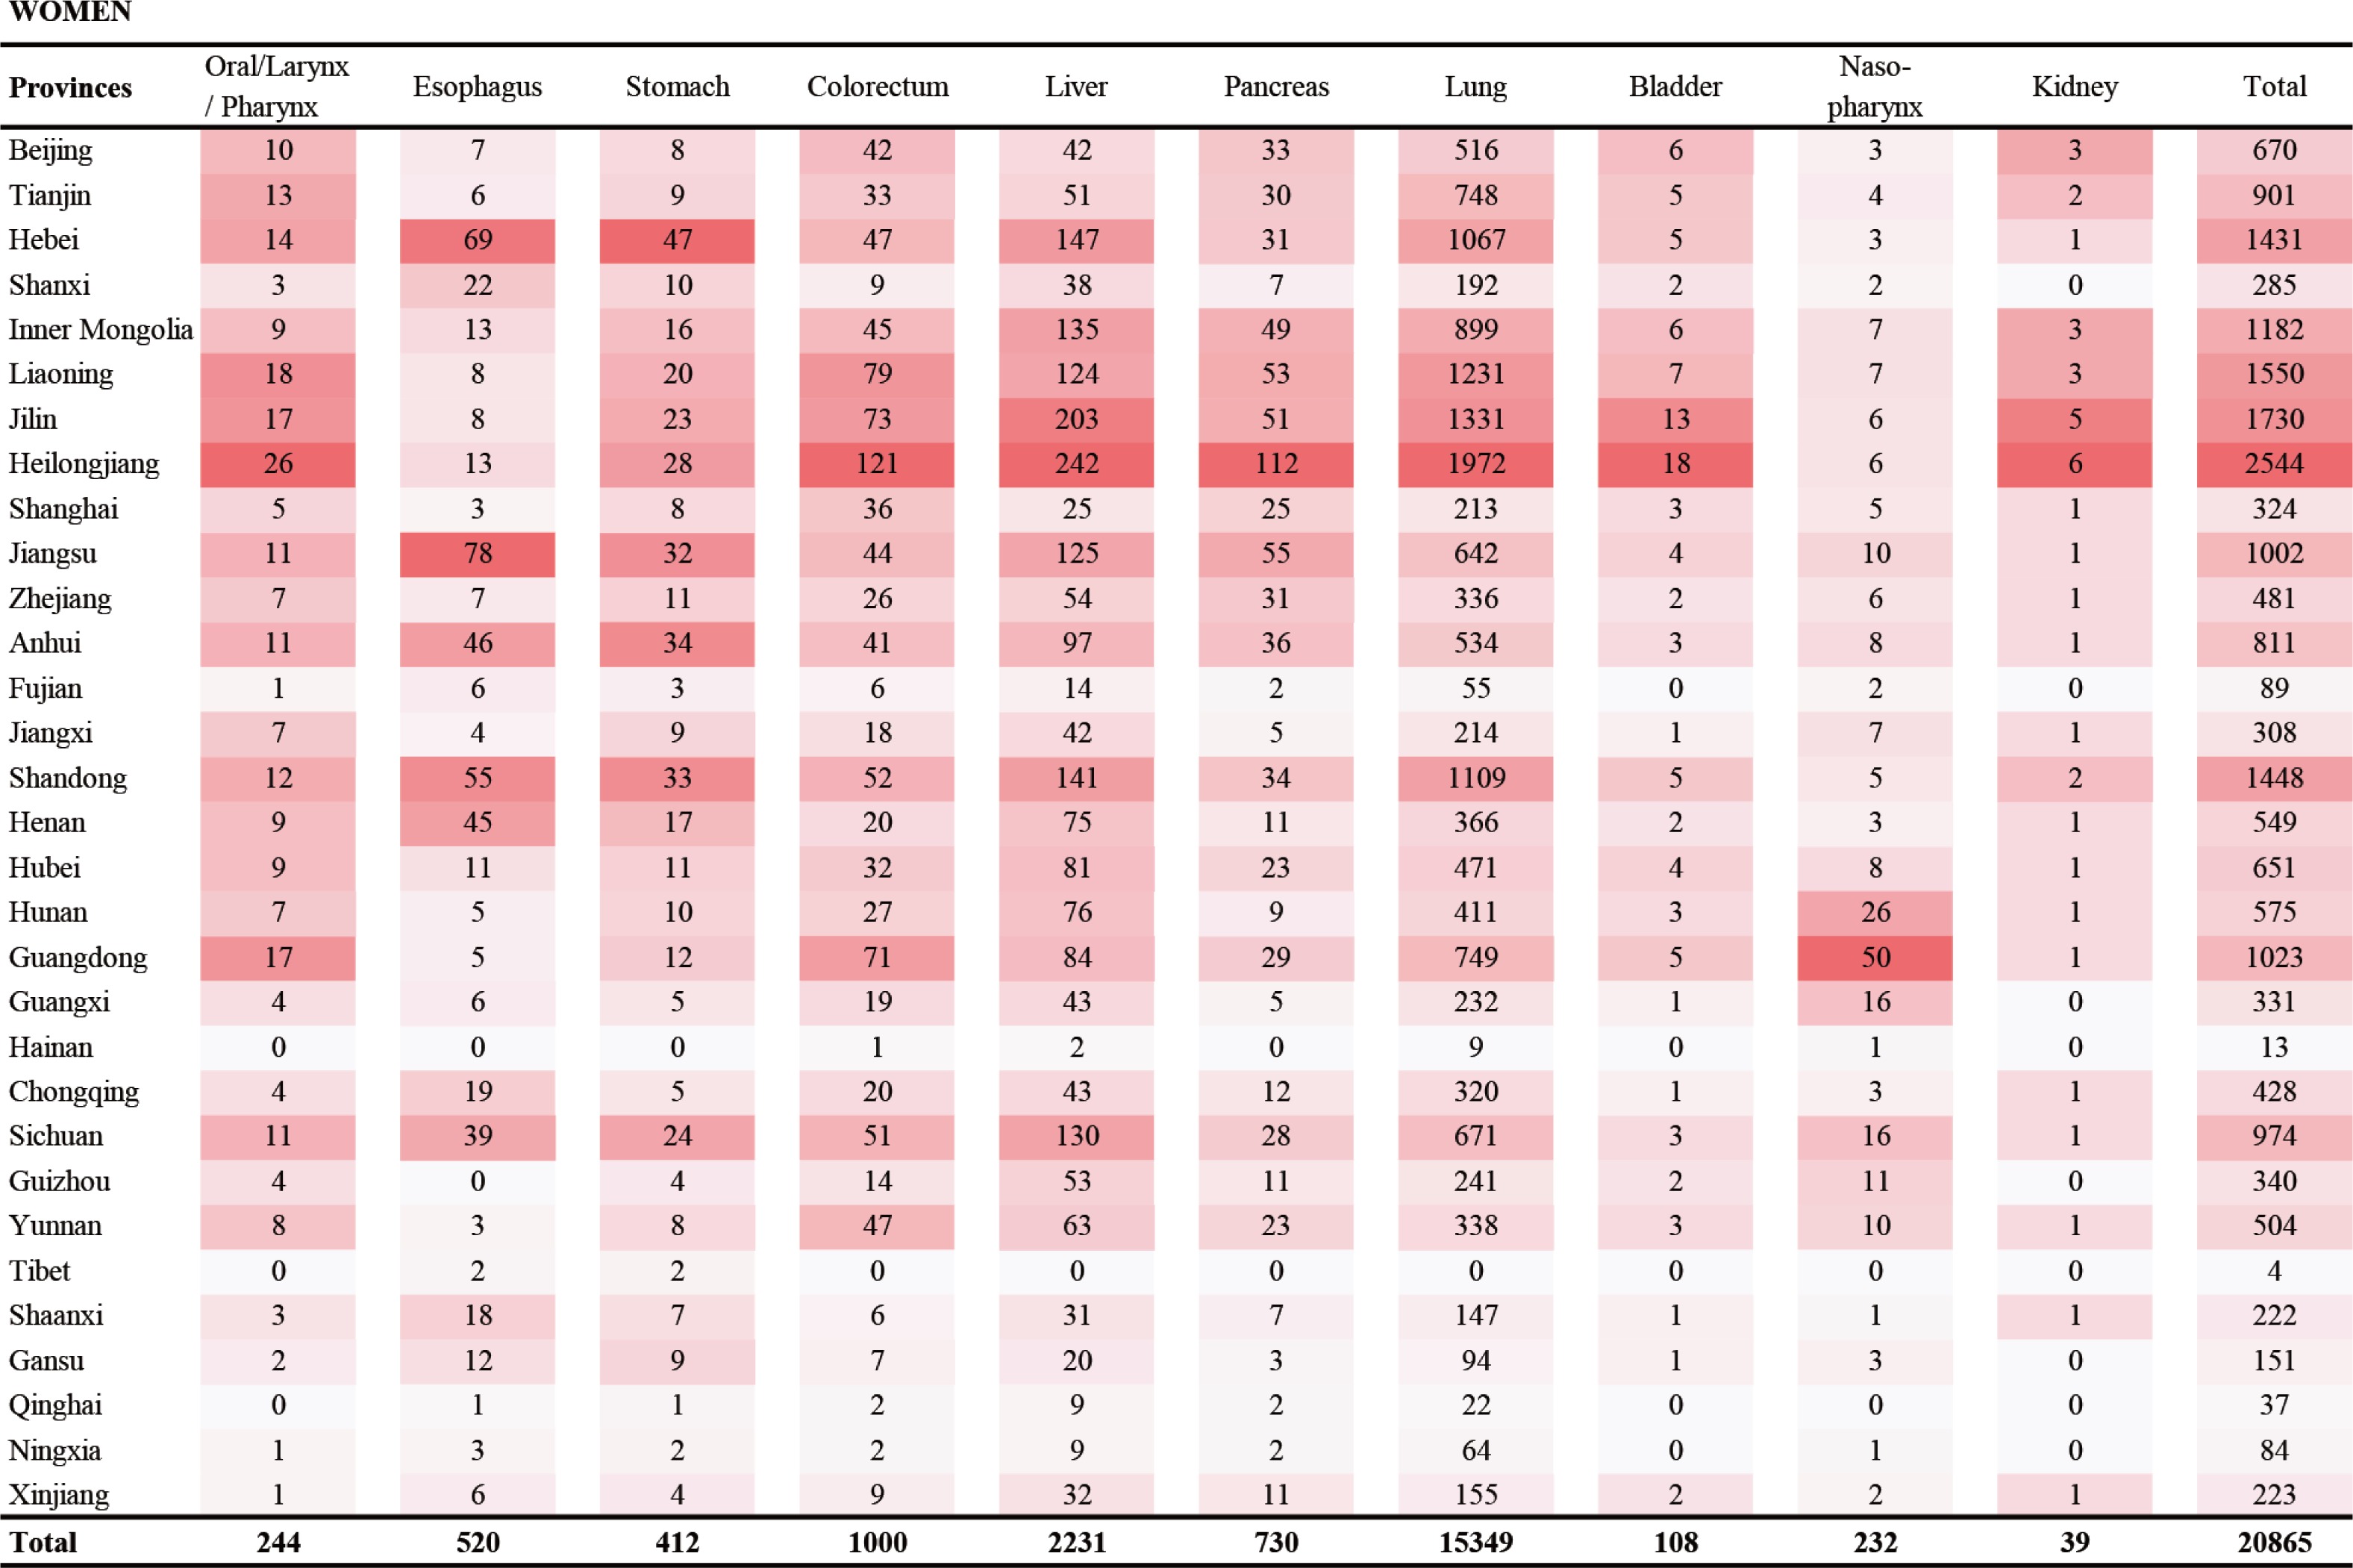
We also present the site-specific smoking-attributable cancer deaths and the corresponding proportions in 31 provinces among men and women (Figures 2 and 3; and Supplementary file, Figures S2 and S3). Overall, cancers of lung and liver were the two main causes of smoking-related cancer deaths for both men and women. For men, stomach cancer was the third cause of smoking-related cancer deaths, followed by cancers of esophagus, mouth/larynx/pharynx, nasopharynx, bladder, colorectum, pancreas, and kidney. For women, colorectal cancer was the third cause of smoking-related cancer deaths, followed by cancers of pancreas, esophagus, stomach, mouth/larynx/pharynx, nasopharynx, bladder, and kidney. The number and proportion of site-specific smoking-attributable cancer deaths varied substantially across provinces.
DISCUSSION
This study provides a systematic evidence-based assessment of province-specific smoking-attributable cancer burden in China. Smoking-attributable cancer mortality in men (PAF=29.34%; 95%CI: 19.21–42.31%) was substantially higher than that in women (PAF=2.61%; 95%CI: 1.01–4.31%), which is mainly explained by the higher smoking prevalence in men. Overall, smoking was responsible for approximately 20% in all cancer deaths in mainland China, but this proportion of smoking-attributable cancer deaths varied substantially across provinces.
Regional variation in PAFs can be primarily explained by differences in smoking prevalence, which has prevailed partly due to variations in tobacco control policies and programs, socioeconomic status and education, culture, and attitudes. Since China ratified the WHO Framework Convention on Tobacco Control in 2005, some metropolitan cities have adopted smoke-free laws prohibiting smoking in public areas. However, the implementation and compliance of smoke-free policy has shown large differences on the subnational level23. Tobacco control policies are heavily influenced by the tobacco industry in all provinces, and tobacco use prevalences are higher in the cities near where tobacco is grown, such as in the Yunnan and Guizhou provinces. However, higher smoking prevalences in the Northeast regions, with nearly no tobacco plantations, can be explained by low smoking cessation rates and low cost of manufactured cigarettes there24. Moreover, low socioeconomic status is considered to be associated with higher smoking prevalence and lower smoking cessation rates25,26. People with lower educational levels are less aware of the adverse effects of smoking. Generally, cigarettes are a popular ‘social currency’ in China, especially in the rural regions27,28.
The larger burden of smoking-related cancer deaths in men than in women most likely reflects the higher prevalence of smoking among men than in women, but there are large discrepancies in PAFs among women across provinces. PAFs among women living in the Southwest provinces were approximately 2–3%, which were lower than the national average, compared with that in men of Southwest China. Moreover, tobacco control policies and programmes appeared not to be well implemented in Northern China. The topmost 4 provinces (Jilin, Tianjin, Inner Mongolia, and Heilongjiang) had PAFs that were three-fold higher than the national average among women, and the top nine provinces with higher PAFs were all located north of the Yangtze River.
The order of site-specific cancer deaths in China has changed in the past decades29, but lung cancer have ranked as first in the smoking-attributable cancer deaths for both genders, consistent with the results from other developing countries30. The tobacco epidemic was responsible for the rapid increase in lung cancer mortality in recent decades31. However, in some provinces, we found that smoking contributed more deaths from cancers of the stomach and esophagus than liver cancer among men, which was driven by the higher mortality rates of stomach and esophageal cancers in these regions.
Our province-specific PAF estimates were comparable with those from the limited evidence available from previous studies in China based on similar methodology. In our study, estimates of provincial PAFs for smoking and cancer deaths in men were higher than the corresponding figures of a previous study32. This discrepancy can be primarily explained by different sources of smoking prevalence. Our study used the smoking prevalence in 1998 as the exposure rate, which was higher than the figures of 2002 used in the Xia et al.32 study, based on a different assumption of the latency time. Although the smoking definitions were similar in both studies, there were some differences in how PAF values were estimated. For smoking-related cancers, we included 10 cancer sites in our study versus 5 major cancer sites together with other minor sites in the Xia et al.32 study. In addition, the estimates of smoking attributable cancer mortality could be affected by the time fluctuation of cancer registered data and different sources of RRs. For most cancers, RRs used in our estimates were abstracted from the results of the Chinese population in a pooled analysis of 21 cohort studies in Asia, which were relatively lower than those in the Western population33,34, but higher than those in the Xia et al.32 study. In their study, RRs were taken from the China Kadoorie Biobank Study from 10 regions during 7 years of follow-up35, which might be underestimated due to the short period of follow-up. Regardless of the PAF disparities, the order of provincial PAFs was still comparable in the two studies (Supplementary file, Figure S4).
In China, smoking prevalence in men declined rapidly during the 1980s and 1990s. Nevertheless, the fraction of smoking-attributable cancer mortality increased slightly over time. The Liu et al.36 study in 1990 reported a fraction of 24.4% in men, but the corresponding figures were 28.0% and 32.7% in 2005 in the Gu et al.12 study and the Wang et al.8 study, respectively. There might be potential overestimation in relative risk for lung cancer sourced from limited Shanghai residents used in the Wang et al.8 study. Methodological differences might be a source of disparity, but potential transition in stages of smoking-related cancer might be a greater contributor. Moreover, our PAF estimates were comparable with the results from the Western populations37, while smoking prevalence was relatively higher in Chinese men7,15,16. In China, widespread tobacco smoking began several decades later than in Europe and North America, thus China was at an earlier stage of the tobacco epidemic compared with the developed countries38. In recent years, smoking prevalence has declined slowly in China due to enforcement of tobacco control policies, but still remains high, especially in men. The current smoke-free policy is still inadequate in reducing prevalence and affecting smoker’s behavior39. As the tobacco epidemic grows, smoking associated cancer deaths will be elevated due to the long latency time of smoking related cancers. More effective efforts in tobacco control, including increasing tobacco taxes and maintaining funding of anti-smoking campaigns, are needed to reduce the smoking-related cancer burden.
Strengths and limitations
A strength of our study is the estimate of site-specific smoking attributable cancer mortality at the provincial level. However, our study has also several limitations and uncertainty. First, in our study, indirect smoking prevalence data were used due to lack of qualified age-specific data on provincial smoking prevalence and smoking prevalence based on self-reported results can be underestimated40, which could affect our estimates. Second, only 10 major types of smoking-related cancers were included in our study, and some other smoking-associated cancers were excluded due to the lack of reliable data, so that our PAF values might be underestimated. Third, secondhand smoking also plays a crucial role in the association of smoking and lung cancer, but it was not included in our study because it is difficult to quantify and there are no corresponding reliable provincial data based on latency time. However, in our previous study, we estimated that 11.1% of lung cancer deaths among non-smoking women were attributable to involuntary smoking from the spouse or at the workplace10, which is very comparable with that of the Xia et al.32 study (11.5%). Finally, in our study, we only considered smoking status as never or ever, and were not able to collect information on the type, starting age, amount and duration of smoking. However, using alternative definitions of smoking may not substantially alter the PAF estimates based on the Xia et al.32 study.
CONCLUSIONS
Our study provides a systematic assessment of province-specific cancer burden of tobacco smoking in China in 2013. We found that smoking was responsible for nearly 20% of cancer deaths in the Chinese population in 2013, and that the proportion of smoking-attributable cancer deaths varies across provinces. Our findings provide strong evidence for more effective programs and innovative new strategies for local tobacco control to reduce the high burden of smoking-related cancers in the provinces of mainland China.