
INTRODUCTION
Tobacco use patterns are changing in the United States (US), with decreases in cigarette smoking prevalence and increases in non-combustible forms of tobacco such as electronic cigarettes (ECs) and oral tobacco use1. Sales of non-combustible tobacco products are predicted to surpass the sales of combustible products in the next years, with revenues and profits from non-combustible tobacco products predicted to exceed those from smoked tobacco products in the next decade1.
While both combusted and non-combusted tobacco products pose health risks to users, they pose vastly different risks2-5. Factory-made cigarettes are the most dangerous tobacco product, responsible for about 480000 deaths annually in the US5,6. Given differential health risks of combusted and non-combusted tobacco products, the shifting patterns of use will likely have important impacts on future tobacco related premature deaths, with declines predicted over the next 50 years7-9. In this study, we describe population level trends in any tobacco use, combustible and non-combustible tobacco use in US adults, by age and sex, from 2015 to 2023.
METHODS
Study population and design
In this cross-sectional trend-analysis, we estimated the current use prevalence of combustible and non-combustible tobacco products using data from the National Health Interview Survey (NHIS) from 2015 to 202310. The NHIS is a continuous, nationwide in-person survey of approximately 27000 adults annually that collects data on a wide range of health topics including information on tobacco product usage of the civilian, non-institutionalized US population. The NHIS uses multistage probability sampling that incorporates stratification, clustering, and oversampling of some subpopulations (e.g. Black, Hispanic, and Asian) in some years. Statistical weighting is used to generate representative national estimates10. The US Census Bureau employs and trains field staff to conduct interviews. They follow standardized procedures and conduct the majority of interviews in person, with some interviews done over the phone when an in-person household interview is not possible.
In this pooled secondary data analysis, we chose to examine trends in combustible and non-combustible tobacco product use starting in 2015, since the questions about tobacco use changed. In 2014, the NHIS survey combined the assessment of cigars and pipe use in a single question, whereas in 2015 separate questions were asked about cigars and pipe tobacco use. Previous studies have demonstrated that the formatting of questions about tobacco use can influence prevalence rates11,12. Harmonized NHIS data from 2015 to 2023 were obtained from IPUMS NHIS10.
Independent variables
The primary independent variable in this study was survey year with nine time points spanning 2015 to 2023. In addition, we report tobacco use prevalence outcomes by age and sex. Age was categorized into four groups (18–24, 25–34, 35–54, and ≥55 years). Sex at birth was defined as either male or female. No other variables were considered in this descriptive study.
Outcome variables
For each survey year, current tobacco use was characterized as: 1) any tobacco use, 2) combustible tobacco use; and 3) non-combustible tobacco use. Any tobacco product use was defined as use of either a combustible and/or non-combustible tobacco product. Combustible products used included cigarettes, cigars, pipe tobacco, and hookah tobacco. Non-combustible products used included electronic cigarettes and oral tobacco (i.e. chew, moist snuff, nicotine pouches). For each year, we defined people who currently reported smoking cigarettes as those who reported smoking 100 or more cigarettes in their lifetime and smoking every day (daily use) or some days (non-daily use). For other combustible tobacco products, current use was defined as any use of cigars, pipe and hookah tobacco in the past 30 days. Non-combustible tobacco product use included any current use of ECs and/or oral tobacco in the past 30 days.
Analyses
Descriptive statistics including frequencies and percentages were generated using SAS 9.4 software (Cary, NC). We applied joinpoint regression to examine trends between 2015 and 2023 in: 1) weighted estimates of any tobacco use prevalence, 2) weighted estimates of combustible tobacco use prevalence, and 3) weighted estimates of non-combustible tobacco use prevalence. We report the annual percentage change (APC) from 2015 to 2023 and 95% confidence intervals (CIs) for males and females and combined, for all age groups and separately for the age groups: 18–24, 25–34, 35–54, and ≥55 years. Joinpoint regression also distinguishes different time segments (i.e. joinpoints) to identify significant differences between time points13-15. We allowed for at most one change in trend (0 or 1 joinpoints). All statistical tests were two-tailed and based on a p<0.05 significance level. The statistical tests are based on Kim et al.14 as implemented in the NCI joinpoint regression software13.
RESULTS
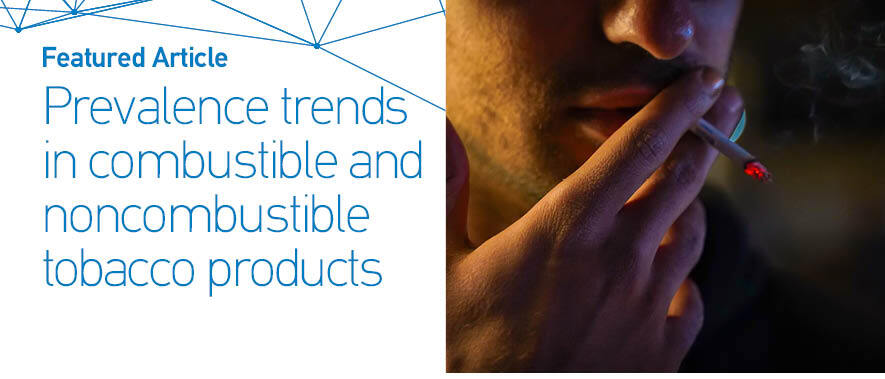
This pooled secondary data analysis includes 51791 respondents, 30565 males and 21226 females. Table 1 shows unweighted number of users, weighted prevalence (%) with 95% CIs for any tobacco use, among those ≥18 years and by different age groups, for males and females and combined, for the years 2015 to 2023. Figure 1 shows the results of the joinpoint analyses overall and by different age and sex. Between 2015 and 2023, across all ages and sex groups combined, any tobacco use decreased at a statistically non-significant APC rate of -1.0% (95% CI: -2.1–0.12). Among those aged 18–24 years, any tobacco use decreased at a statistically significant APC rate of -7.6% (95% CI: -15.2 – -1.9) between 2015 and 2018, but stabilized from 2018 to 2023 with an APC of 0.6% (95% CI: -2.7–9.4).
Figure 1
Joinpoint regression plots for the prevalence+ of any tobacco use*, by age and sex, for adult participants in the US NHIS 2015–2023
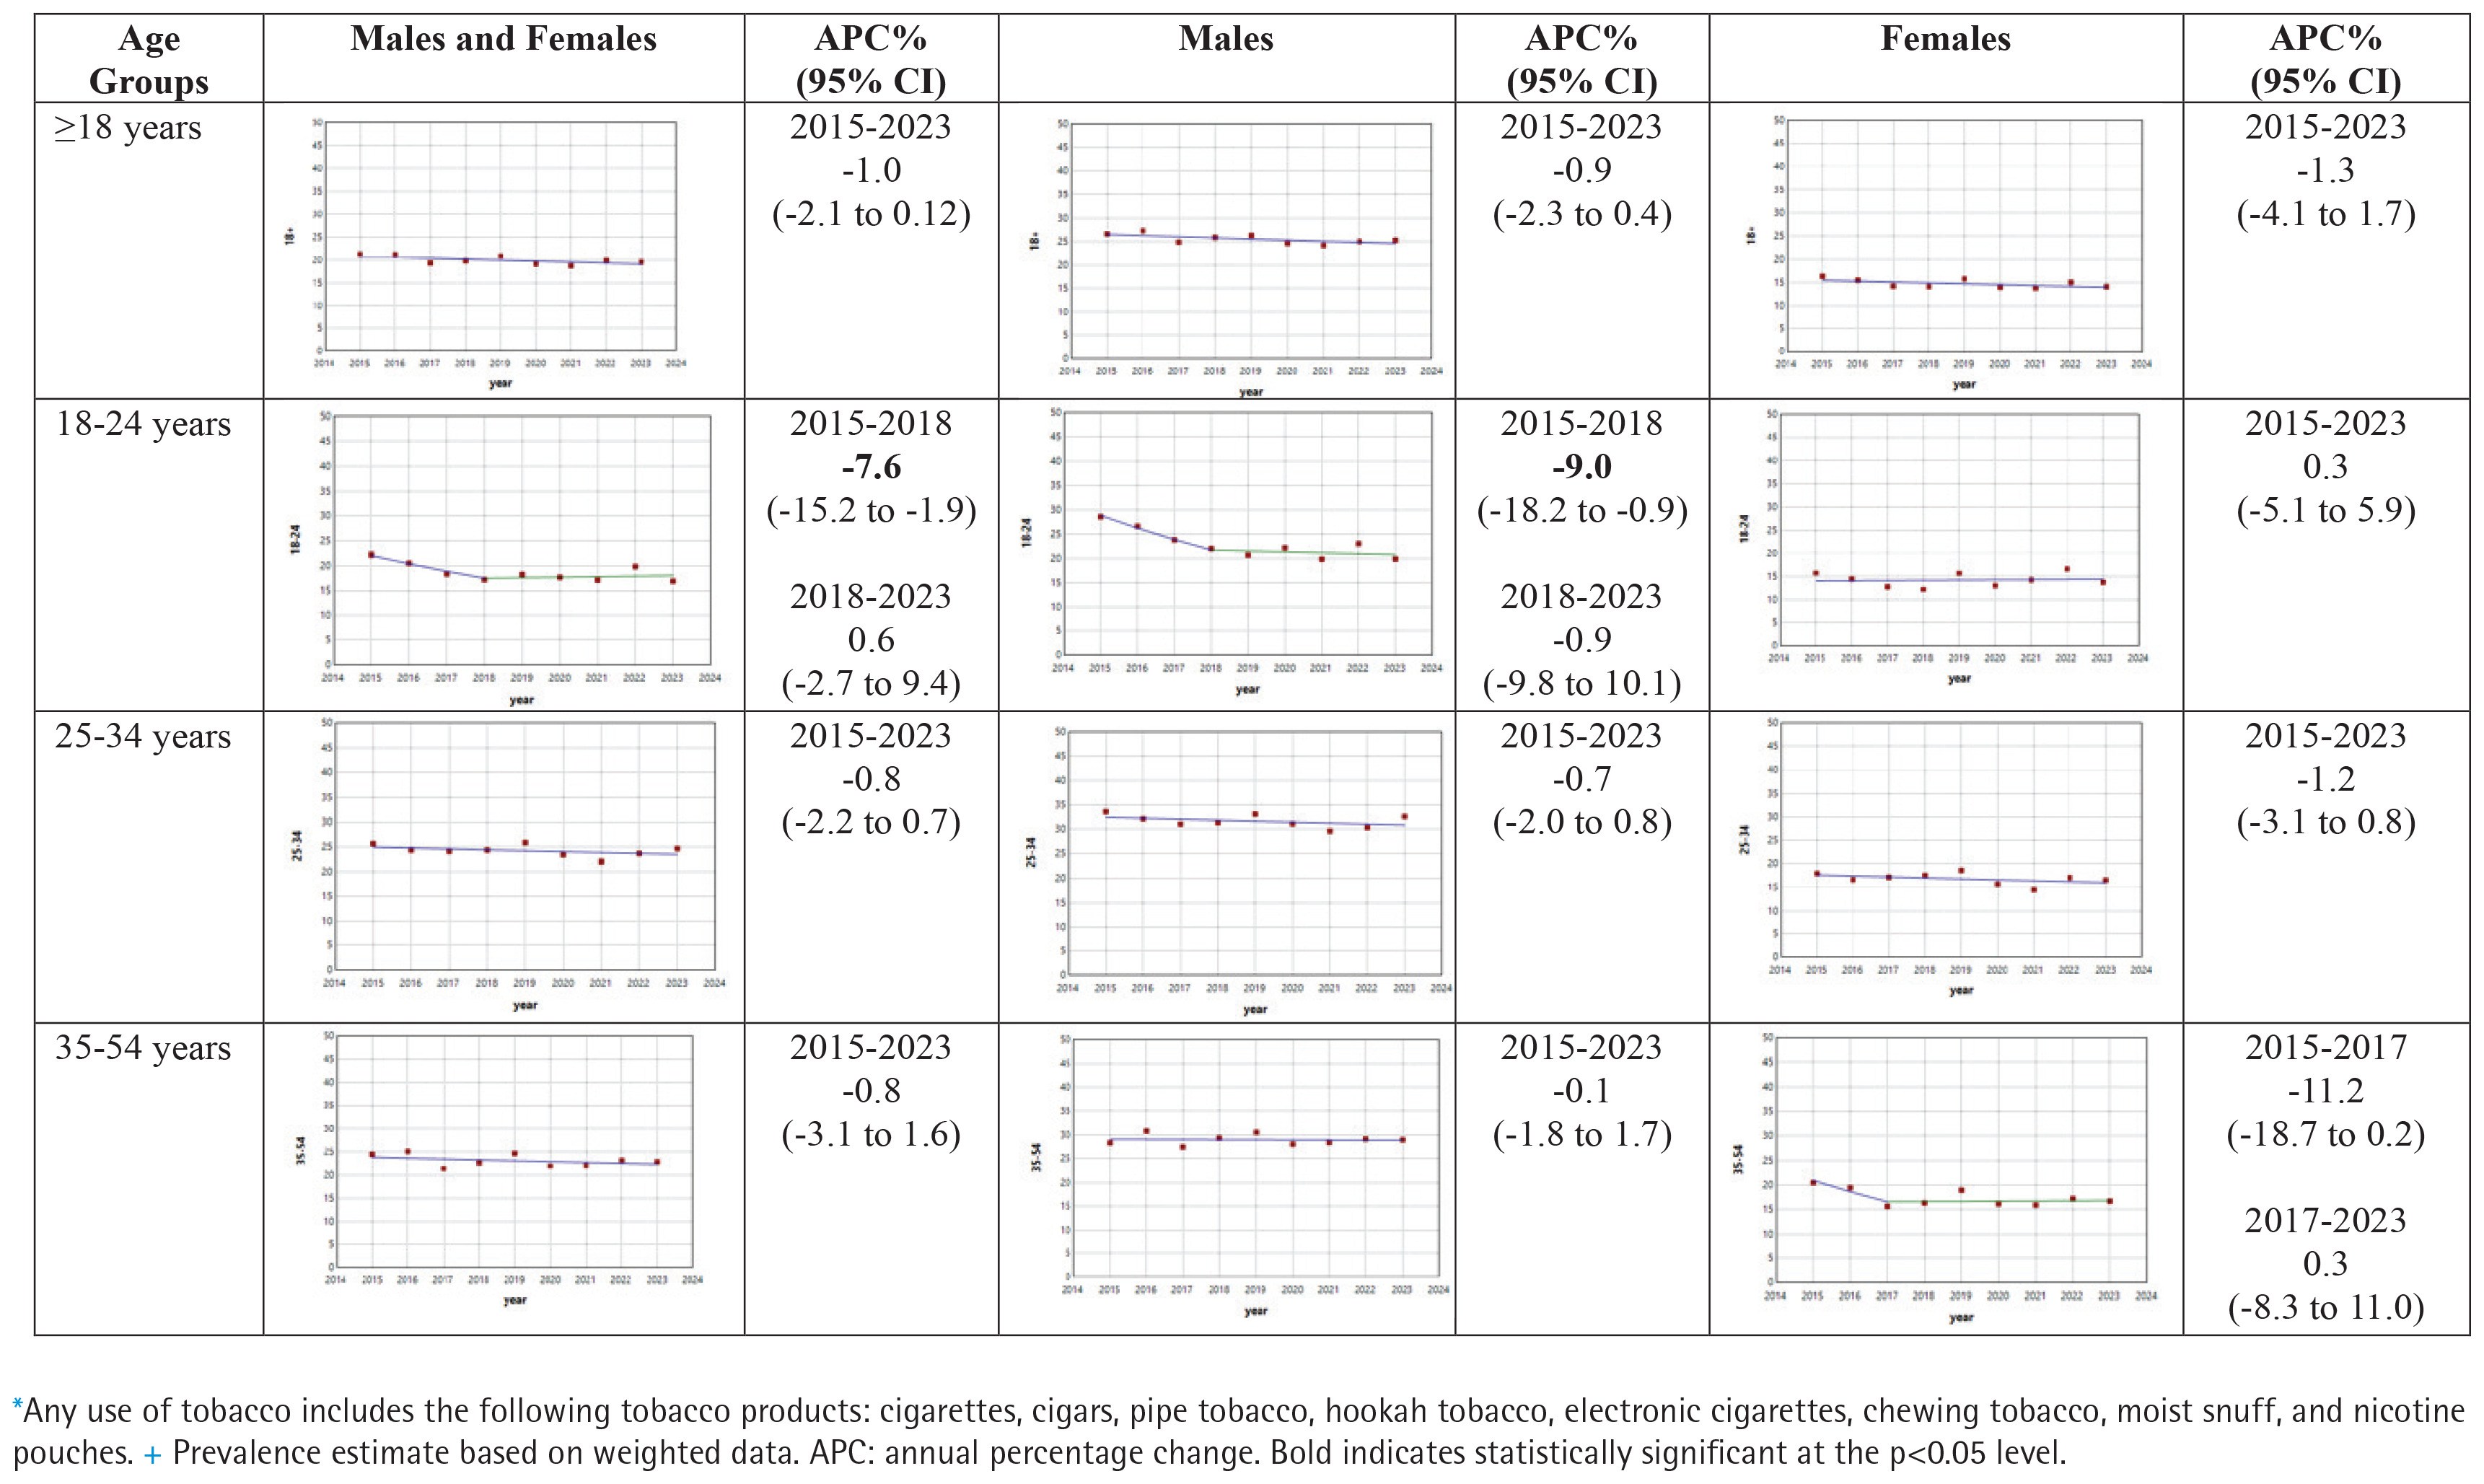
Table 1
Unweighted number (n) of people reporting any tobacco use* and weighted prevalence (%) estimates with 95% confidence intervals, by age and sex, for participants in the US NHIS 2015–2023
Table 2 shows unweighted number of users, weighted prevalence (%) with 95% CIs for combustible tobacco product use, among those ≥18 years and by different age groups, for males and females and combined, for the years 2015 to 2023. Figure 2 shows the results of the joinpoint analyses for combustible tobacco product use. Overall, combustible tobacco decreased at a statistically significant APC rate of -3.6% (95% CI: -4.6 – -2.6), with differences by age group (18–24 years: -12.2%, 95% CI: -14.6 – -9.7; 25–34 years: -5.2%, 95% CI: -6.6 – -3.8; 35–54 years: -2.5%, 95% CI: -4.2 – -0.9; and ≥55 years: -1.2%, 95% CI: -1.8 – -0.5). For females, the magnitude of the decline in combustible tobacco use prevalence was most apparent in younger age groups (i.e. aged 18–34 years) after 2019.
Table 2
Unweighted number (n) of people reporting combusted tobacco use* and weighted prevalence (%) estimates with 95% confidence intervals, by age and sex, for participants in the US NHIS 2015–2023
Figure 2
Joinpoint regression plots for the prevalence+ of combusted tobacco use*, by age and sex, for adult participants in the US NHIS 2015–2023
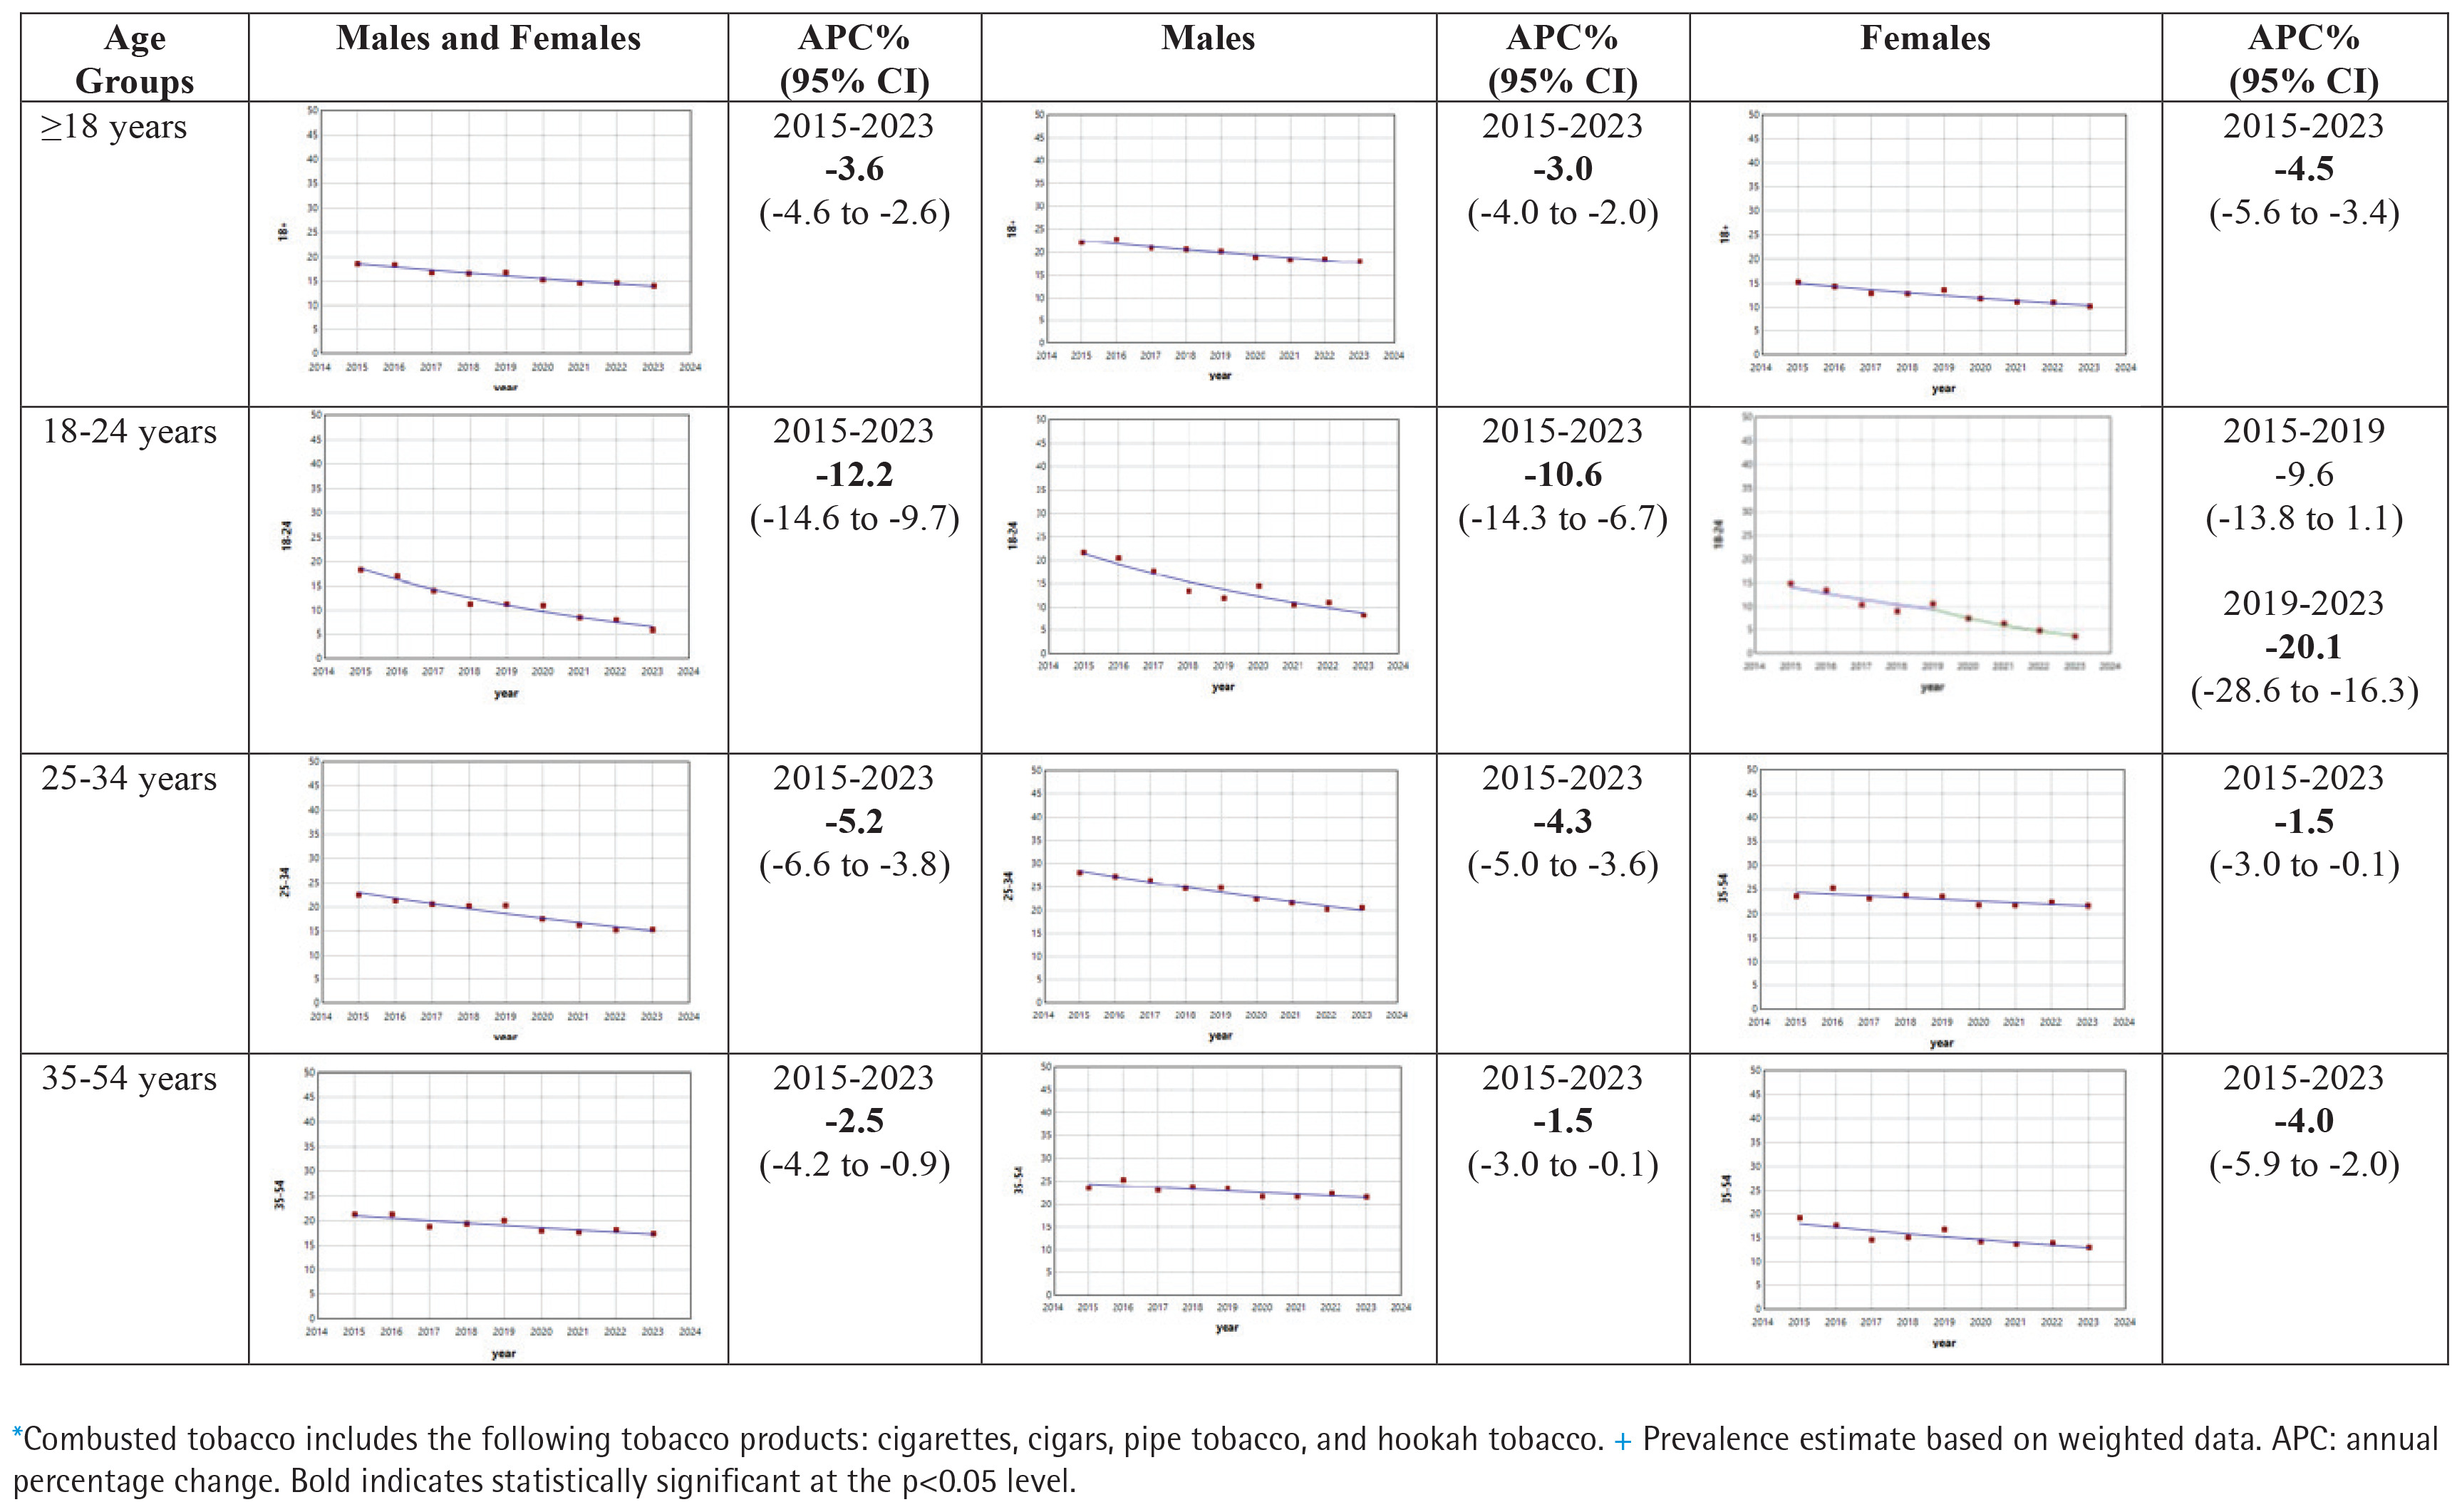
Table 3 shows unweighted number of users, weighted prevalence (%) with 95% CIs for non-combustible tobacco product use, among those ≥18 years and by different age groups, for males and females and combined, for the years 2015 to 2023. Figure 3 shows the results of the joinpoint analyses for non-combustible tobacco product use. Overall, non-combustible tobacco product prevalence increased at a statistically significant APC of 8.9% (95% CI: 6.5–15.8) after 2017, with increases in all age groups and both sexes, but with larger increases in younger age groups (i.e. 18–34 years).
Table 3
Unweighted number of people reporting non-combusted tobacco use*, and weighted prevalence (%) estimates with 95% confidence intervals, by age and sex, for participants in the US NHIS 2015–2023
Figure 3
Joinpoint regression plots for the prevalence+ of non-combusted tobacco use*, by age and sex, for adult participants in the US NHIS 2015–2023
Supplementary file Tables 1 and 2 show unweighted number of users, weighted prevalence (%) with 95% CIs for cigarettes and non-cigarette combustible tobacco product use by survey year, age, and sex. Supplementary file Figures 1 and 2 show the results of the joinpoint analyses for cigarettes and non-cigarette combustible tobacco use. The results show that decreasing combustible tobacco products use prevalence is due to declining cigarette use.
Supplementary file Tables 3 and 4 show unweighted number of users, weighted prevalence (%) with 95% CIs for ECs and oral tobacco product use by survey year, age, and sex. For oral tobacco product use, the results are restricted to males and females combined, and for males, since the number of exclusive female users of oral tobacco was too low to reliably estimate prevalence rates. Supplementary file Figures 3 and 4 show the results of the joinpoint analyses for ECs and oral tobacco products trends. The results reveal increasing prevalence of EC use among both males and females after 2017. At least up until 2023, the use of oral tobacco products declined in nearly all age groups except for those aged ≥55 years.
DISCUSSION
Overall adult use of any tobacco products remained stagnant between 2015 and 2023. However, the overall statistically non-significant trend in any tobacco use masks important changes in the types of tobacco products consumers are using. Combustible tobacco product use decreased annually among males and females, but the decline was much more apparent among younger adults, which coincides with decreasing cigarette smoking prevalence. Conversely, non-combustible product use increased significantly after 2017, especially among younger adults, initially among males and followed by females, due to increased use of ECs. While the decline in combustible tobacco product use is good news, the rate of decline was much less among those aged ≥35 years, where cigarette use remained high and only slowly declined between 2015 and 2023.
The rapid increase in non-combustible tobacco use among younger adults reflects the growing popularity of ECs and supports the idea that ECs are replacing cigarettes as the main type of tobacco product consumed1,9. In 2023, the prevalence of EC use was greater than cigarettes among adults aged 18–24 years. While non-combustible tobacco product use can cause nicotine dependence and is not completely safe, the absence of burned tobacco reduces exposure to harmful and potentially harmful chemicals compared to combustible tobacco use, especially cigarettes16-19.
Limitations
While the findings from this study provide a broad non-causal descriptive assessment of population trends in tobacco product use, these findings should not be over interpreted as being predictive of future tobacco-related disease rates, for several reasons. First, we are only reporting the prevalence of current use defined as use in the past 30 days which fails to capture frequency, intensity and duration of product use all of which are important determinants of future health risks5. Second, self-reported tobacco use is prone to information bias and misclassification. For example, the negative stigma associated with smoking cigarettes has been found to be associated with underreporting smoking in surveys20. Also, not all respondents will be aware of the different tobacco products asked about in the survey, which may contribute to measurement error. Third, we only report cross-sectional population level prevalence rates and do not consider individual patterns of tobacco product use which are likely complex with people transitioning overtime between different tobacco products use states, including using more than one product at a time (i.e. dual use)21-27. For example, studies of people who report currently using cigarettes have found that most are still smoking cigarettes for a year or even five years, suggesting that different tobacco products might convey different risks of abuse liability23-28. Fourth, there are inherent limitations of the joinpoint analyses presented in this study, since we use only nine data points. It is possible results will change as additional data points become available. Fifth, the US findings from this study may not apply to other countries.
CONCLUSIONS
This study found that the types of tobacco products used by US adults has shifted between 2015 and 2023. Combustible use – especially cigarettes – is decreasing, particularly in young adults, while non-combustible use is increasing. Continued monitoring of tobacco product use trends is warranted to understand market dynamics, identify priorities for regulatory and tobacco control policies, and to attempt to predict future tobacco-related deaths.