

INTRODUCTION
Cardiovascular disease (CVD) is the leading cause of death in the US and globally, producing significant health and economic burden1,2. Combustible cigarette smoking is a well-established independent risk factor for CVD2-5. Leveraging such evidence, coupled with robust regulatory policies and enforcement, have resulted in a steady decline in combustible cigarette use across different population subgroups in the US6,7.
Despite the decrease in the rates of smoking, the popularity of non-cigarette tobacco products has increased in the past few decades8-10. Between 2000 and 2015, smokeless tobacco use among US adults increased by 23%8. In 2020, 2.3% of US adults reported past 30-day smokeless tobacco use, while 1.6% of youth reported smokeless tobacco use in 20226,11. Despite a reduction in cigar use in some subgroups, use has increased 68% among adult women12. Additionally, cigar use has decreased among older adults but increased from 12.0% in 2002 to 12.7% in 2008 among those aged 18–25 years13. Lastly, the use of e-cigarettes has become increasingly popular, with approximately 5.1% of US adults reporting past 30-day use of e-cigarettes in 202014. Despite the significant increase in the use of non-traditional tobacco products, important knowledge gaps on their health effects remain, and several studies have reported mixed results on the association of these non-traditional tobacco products and CVD risk14,15.
The use of longitudinal data such as the Population Assessment of Tobacco and Health (PATH) has been instrumental in studying the potential health effects of newer tobacco products such as e-cigarettes15,16. The PATH study is, however, limited by self-reported, non-adjudicated outcomes that could result in misclassification, short follow-up period, and the low prevalence of non-cigarette tobacco product use17. Given the relatively low prevalence of non-traditional tobacco products in individual prospective cohort studies, the synthesis of various datasets can lead to the construction of high-powered and phenotypically diverse databases of unparalleled size. Therefore, prioritizing data synthesis from multiple existing cohorts can offset the financial, technical, and time constraints related to developing new well-powered studies, which supported the rise of large consortia like the Cross-Cohort Collaboration (CCC)18.
The CCC was instituted to develop the infrastructure, policies, and design procedures for harmonization and eventual data sharing for the purpose of studying chronic disease epidemiology. The objective of the tobacco working group arm of the CCC is to provide additional insight into the cardiovascular health implications of non-cigarette tobacco product use with an emphasis on subclinical and clinical CVD.
The 2016 Tobacco Deeming rule extended the regulatory authority of the US Food and Drug Administration (FDA) to include the manufacturing, marketing, and distribution of non-cigarette tobacco products, including e-cigarettes, pipe tobacco, cigars, hookah/waterpipe tobacco, and e-liquids19. The CCC-Tobacco, which is partly supported by the Tobacco Centers of Regulatory Science (TCORS) program, funded by the Center for Tobacco Products of the FDA, seeks to inform the regulatory efforts of the agency directed towards non-traditional tobacco products. The CCC-Tobacco received ethical approval from the Johns Hopkins institutional review board. This article describes the design and methodology for creating and harmonizing the CCC-Tobacco dataset and presents the distribution of baseline sociodemographic characteristics and tobacco exposure in CCC-Tobacco.
METHODS
Cohorts that comprise the CCC-Tobacco
Twenty-three prospective observational cohort studies in the US and Brazil with baseline and follow-up data on tobacco use have currently provided de-identified individual-level data to the CCC-Tobacco. These include nine landmark cohorts which were originally designed to study CVD epidemiology (i.e. traditional cardiovascular cohorts): Atherosclerosis Risk in Communities (ARIC) Study, Coronary Artery Risk Development in Young Adults (CARDIA) Study, Cardiovascular Health Study (CHS), Dallas Heart Study (DHS), Framingham Heart Study (FHS), Hispanic Community Health Study/Study of Latinos (HCHS/SOL), Jackson Heart Study (JHS), Multi-Ethnic Study of Atherosclerosis (MESA), Multiple Risk Factor Intervention Trial (MRFIT), the Reasons for Geographic and Racial Differences in Stroke Study (REGARDS), and the Strong Heart Study (SHS). Other cohorts included in the CCC-Tobacco are (non-cardiovascular specific cohorts): Baltimore Longitudinal Study of Aging (BLSA); Chronic Renal Insufficiency Cohort (CRIC); the Brazilian Longitudinal Study of Adult Health (ELSA-Brasil); Genetics of Lipid Lowering Drugs and Diet Network (GOLDN); the Health, Aging and Body Composition Study (Health ABC); the Osteoporotic Fractures in Men Study (MrOS); Rancho Bernardo Study (RBS) of Healthy Aging; Study of Osteoporotic Fractures (SOF); the Study of Women’s Health Across the Nation (SWAN); and Women’s Health Initiative (WHI). Characteristics of participating cohorts and their geographical distribution are presented in Table 1 and Figure 1, respectively. For additional details, including study-specific rationale, design, funding, and protocols, and appropriate links to background reading, are given in Supplementary file Table 1. Additionally, the contribution of each participating cohort to the whole CCC-Tobacco dataset is given in Supplementary file Figure 1.
Table 1
Characteristics of the twenty-three participating cohorts of the Cross-Cohort Collaboration-Tobacco dataset
| Participating cohorts (website link) | Cohort population and description | Enrollment years |
|---|---|---|
| Traditional cardiovascular cohorts | ||
| Atherosclerosis Risk in Communities Study (ARIC) | 15792 in 4 US communities aged 45–64 years | 1987 |
| Coronary Artery Risk Development in Young Adults (CARDIA) | 5115 at 4 US field centers aged 18–30 years | 1985–86 |
| Cardiovascular Health Study (CHS) | 5888 adults aged ≥65 years in 4 US communities | 1989–1999 |
| Dallas Heart Study (DHS) | 6101 from multi-ethnic cohort of Dallas County | 2000 |
| Framingham Heart Study (FHSL) | 5209 adult population of Framingham Massachusetts aged 30–62 years (original cohort) | 1948 |
| Offspring cohort: 5124 adult children of the original cohort and their spouses aged 30–74 years | 1971 | |
| FHS 3rd Gen: 4095 men and women aged >19 years with ≥one parent in the offspring study | 2002 | |
| Hispanic Community Health Study/Study of Latinos (HCHS-SOL) | 16000 persons of Hispanic/Latino origin from 4 field US centers aged 18–74 years | 2006 |
| Jackson Heart Study (JHS) | 5306 community-based African Americans from 3 counties in Jackson MS aged 35–84 years | 2000–2004 |
| Multi-Ethnic Study of Atherosclerosis (MESA) | More than 6000 multi-ethnic men and women from 6 communities in the US aged 45–84 years | 2000–2002 |
| The Multiple Risk Factor Intervention Trial (MRFIT) | 12866 men aged 35–57 years enrolled in coronary heart disease intervention trial | 1972 |
| Reasons for Geographic and Racial Differences in Stroke (REGARDS) | 30239 employed men and women aged ≥45 years | 2003 |
| Strong Heart Study (SHS) | 4500 American Indian tribal members aged 35–74 years | 1988 |
| Non-cardiovascular specific cohorts | ||
| Baltimore Longitudinal Study of Aging (BLSA) | >3000 men and women aged >20 years | 1958 |
| Chronic Renal Insufficiency Cohort Study (CRIC) | 3939 with chronic kidney disease (1560 older adults during third phase) | 2001–2013 (I & II) 2013–2015 (III) |
| Brazilian Longitudinal Study of Adult Health (ELSA-Brasil) | 15000 active and retired civil servants from teaching and research institutions aged 35–74 years | 2008 |
| Genetics of Lipid Lowering Drugs and Diet Network (GOLDN) | 1200 white family members from 2 genetically homogeneous US centers aged >18 years | 2004–2006 |
| Health Aging and Body Composition Study (Health ABC) | 3075 community-dwelling in Memphis TN or Pittsburgh PA and aged 70–79 years | 1997 |
| The Osteoporotic Fractures in Men Study (MrOS) | 6000 senior men ≥65 years from 6 US communities | 2000 |
| Rancho Bernardo Study (RBS) of Healthy Aging | 6339 Community based cohort of all residents of Rancho Bernardo | 1972–1974 |
| The Study of Osteoporotic Fractures (SOF) | 10366 older women aged ≥65 years | 1986 |
| Study of Women’s Health Across the Nation (SWAN) | 3302 women in longitudinal study of women’s health in 7 US research centers | 1996–1997 |
| Women’s Health Initiative (WHI) | 161808 postmenopausal women aged 50–79 years | 1993 |
| Total population (N) | 322782 | 1948–2015 |
Figure 1
Geographical distribution of participating cohorts’ investigations sites Cross-Cohort Collaboration-Tobacco dataset
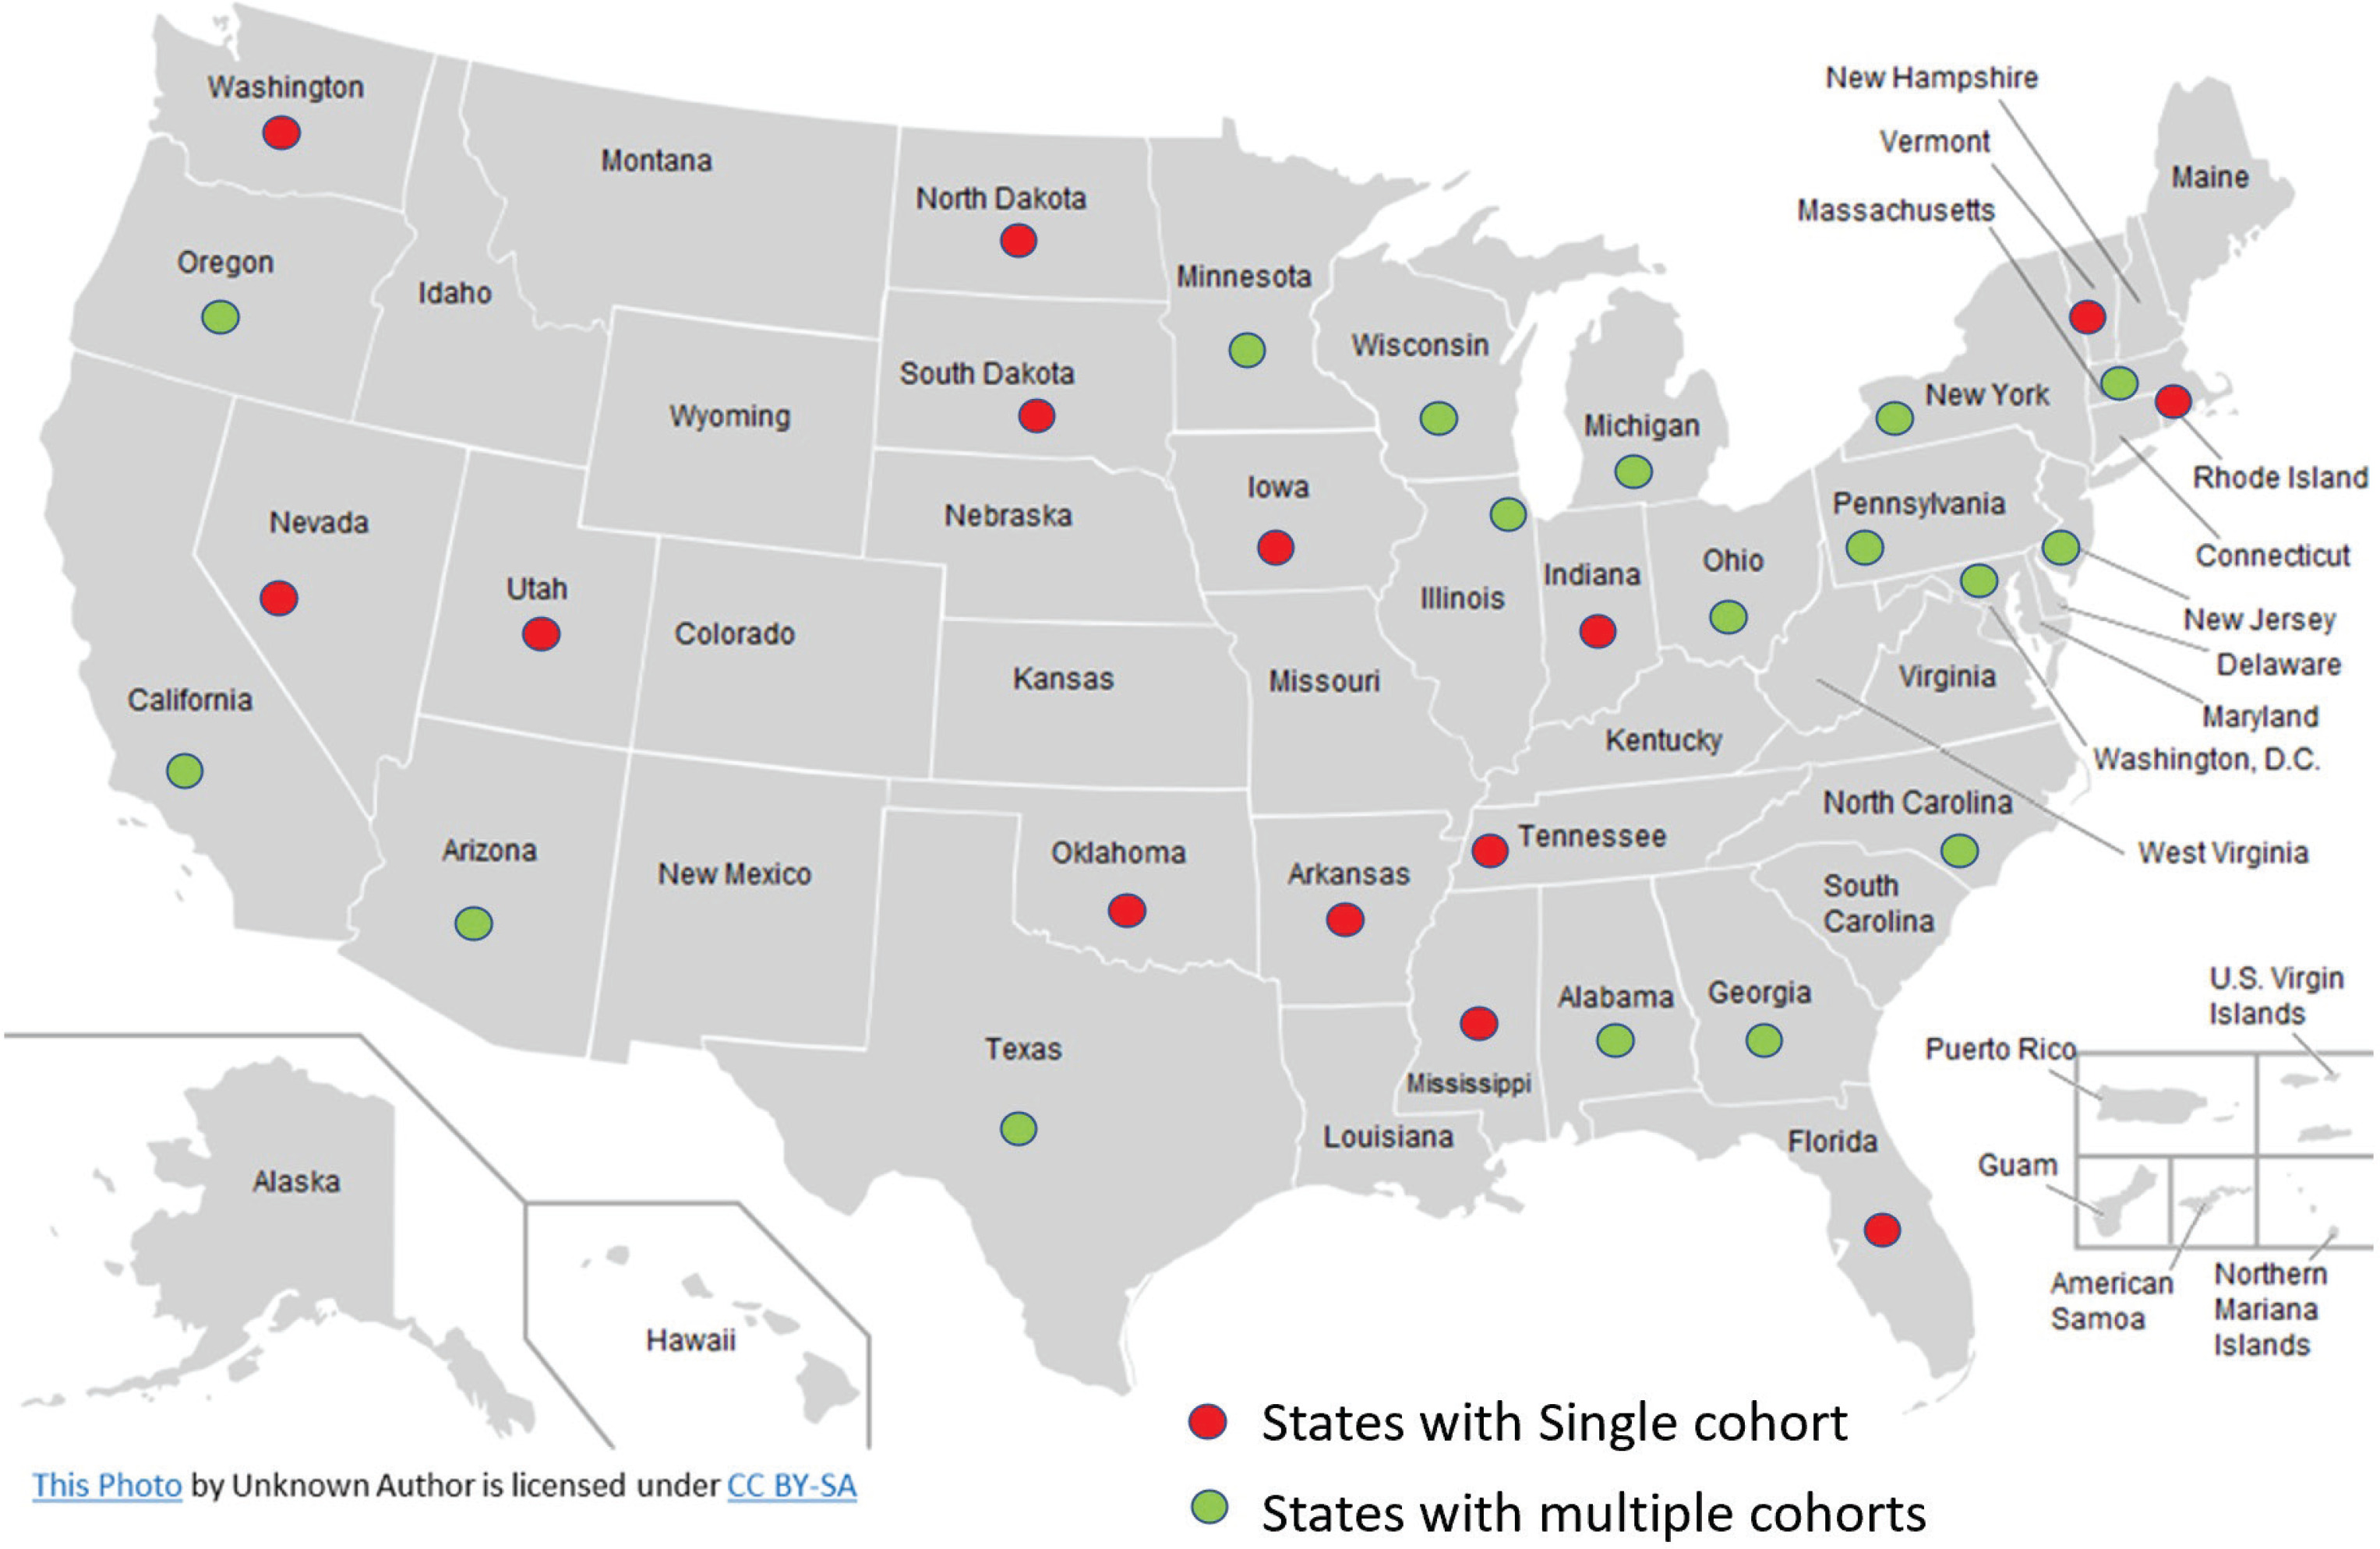
Most of the studies began recruiting participants between 1948 and 2008. Four of the cardiovascular studies (ARIC, CARDIA, DHS, MESA) specifically recruited participants from different racial groups, and three were designed to primarily study specific racial or ethnic groups (Hispanic/Latino participants in HCHS/SOL, Black participants in JHS, and Indigenous participants in SHS). The WHI is one of the largest women’s health projects ever launched in the US, having enrolled more than 161000 women aged 50–79 years at 40 clinical centers. The main areas of research were CVD, cancer, and osteoporotic fractures in postmenopausal women.
All the cohorts have extensive data on participants’ baseline sociodemographic characteristics, and gather data on participant tobacco use behaviors, although this varies in scope and detail. Many cohorts that comprise the CCC-Tobacco have collected detailed information on participants’ health and behavior for as long as fifty years of follow-up. Twenty-one cohorts (except ELSA-Brasil and SOF) ascertain CVD including myocardial infarction, stroke, atrial fibrillation, and heart failure, and several cohorts report measures of subclinical cardiovascular injury including measures of inflammation, coronary artery calcium (CAC), carotid plaque, carotid intima-media thickness (cIMT), pulse-wave velocity, and ankle-brachial index.
Participants
Cohort participants previously provided informed consent for in-person, telephone, and/or email contact and for the abstraction of medical records. The institutional review board at each research center approved the study protocol for each cohort. The twenty-three cohorts in the consortium provided data from approximately 322000 participants. All forty-eight continental US states are represented among CCC-Tobacco participants, including rural, suburban, and urban communities (Figure 1). In all, the cohorts included in the CCC-Tobacco have been or are being conducted across approximately forty field/clinical centers. One cohort with extensive geographical reach, the REGARDS, operates via telephone and in-home exams only.
CCC-Tobacco variable domains
We requested and obtained individual-level de-identified data from all participating studies based on the following variable list. Baseline characteristics included sociodemographic variables such as age, sex, race/ethnicity, study site, education status, and income level. Past medical history, family history, and anthropometric variables including body mass index (BMI) were also requested. Measured cardiometabolic parameters including systolic blood pressure (SBP), diastolic blood pressure (DBP), total cholesterol (TC), high-density lipoprotein (HDL) cholesterol, low density lipoprotein (LDL) cholesterol, lipoprotein a [Lp(a)], and triglycerides data were requested. Data on the use of lipid-lowering therapy, anti-hypertensive therapy, anti-hyperglycemic medications, and anti-platelet medications were also collected.
Furthermore, self-reported health behaviors such as physical activity, diet, and the use of traditional and non-traditional tobacco products were requested from all the cohorts. Comorbidities were defined as follows. Obesity was defined as BMI ≥30 kg/m2. Hypertension was defined as SBP ≥140 mmHg, DBP ≥90 mmHg, or use of hypertensive medications. Diabetes was defined as a fasting blood glucose level ≥126 mg/dL, previous diagnosis of diabetes (treated or untreated), or use of antidiabetic medications. Dyslipidemia was defined as if one the following were present: 1) TC >240 mg/dL; 2) Triglycerides >200 mg/dL; 3) HDL-C <50 mg/dL (female) or <40 mg/dL (male); 4) LDL-C >160 mg/dL; or 5) the use of lipid lowering therapies. Hyperlipidemia was defined as either: 1) TC >240 mg/dL; 2) Triglycerides >200 mg/dL; or 3) LDL-C >160 mg/dL.
Participating studies provided baseline and longitudinal data over multiple study visits on the use of cigarettes, cigars, pipes, smokeless tobacco, and e-cigarettes, as well as secondhand smoke exposure. Data on the intensity and duration of exposure including tobacco-product use-years and usage per day were also collected when available. Additionally, data on the patterns and changes in tobacco use over time such as poly-product use, product switching, and quitting were collected.
Biomarkers of subclinical cardiovascular injury based on three domains – subclinical inflammation, thrombosis, and atherosclerosis – were collected. Inflammatory biomarkers included high-sensitivity C-reactive protein (hsCRP) and interleukin-6. Thrombosis biomarkers included fibrinogen and D-dimer. Measures of atherosclerosis included CAC, carotid plaque, cIMT test readings, pulse-wave velocity, and ankle-brachial index. The most recent data on cardiovascular outcomes were requested from each participating study. The outcomes included cardiovascular events (myocardial infarction, stroke, atrial fibrillation, heart failure) and mortality (coronary, cardiovascular, and all-cause). Furthermore, harmonized time-to-event variables will be constructed for the purpose of future survival analysis.
Data acquisition and transfer
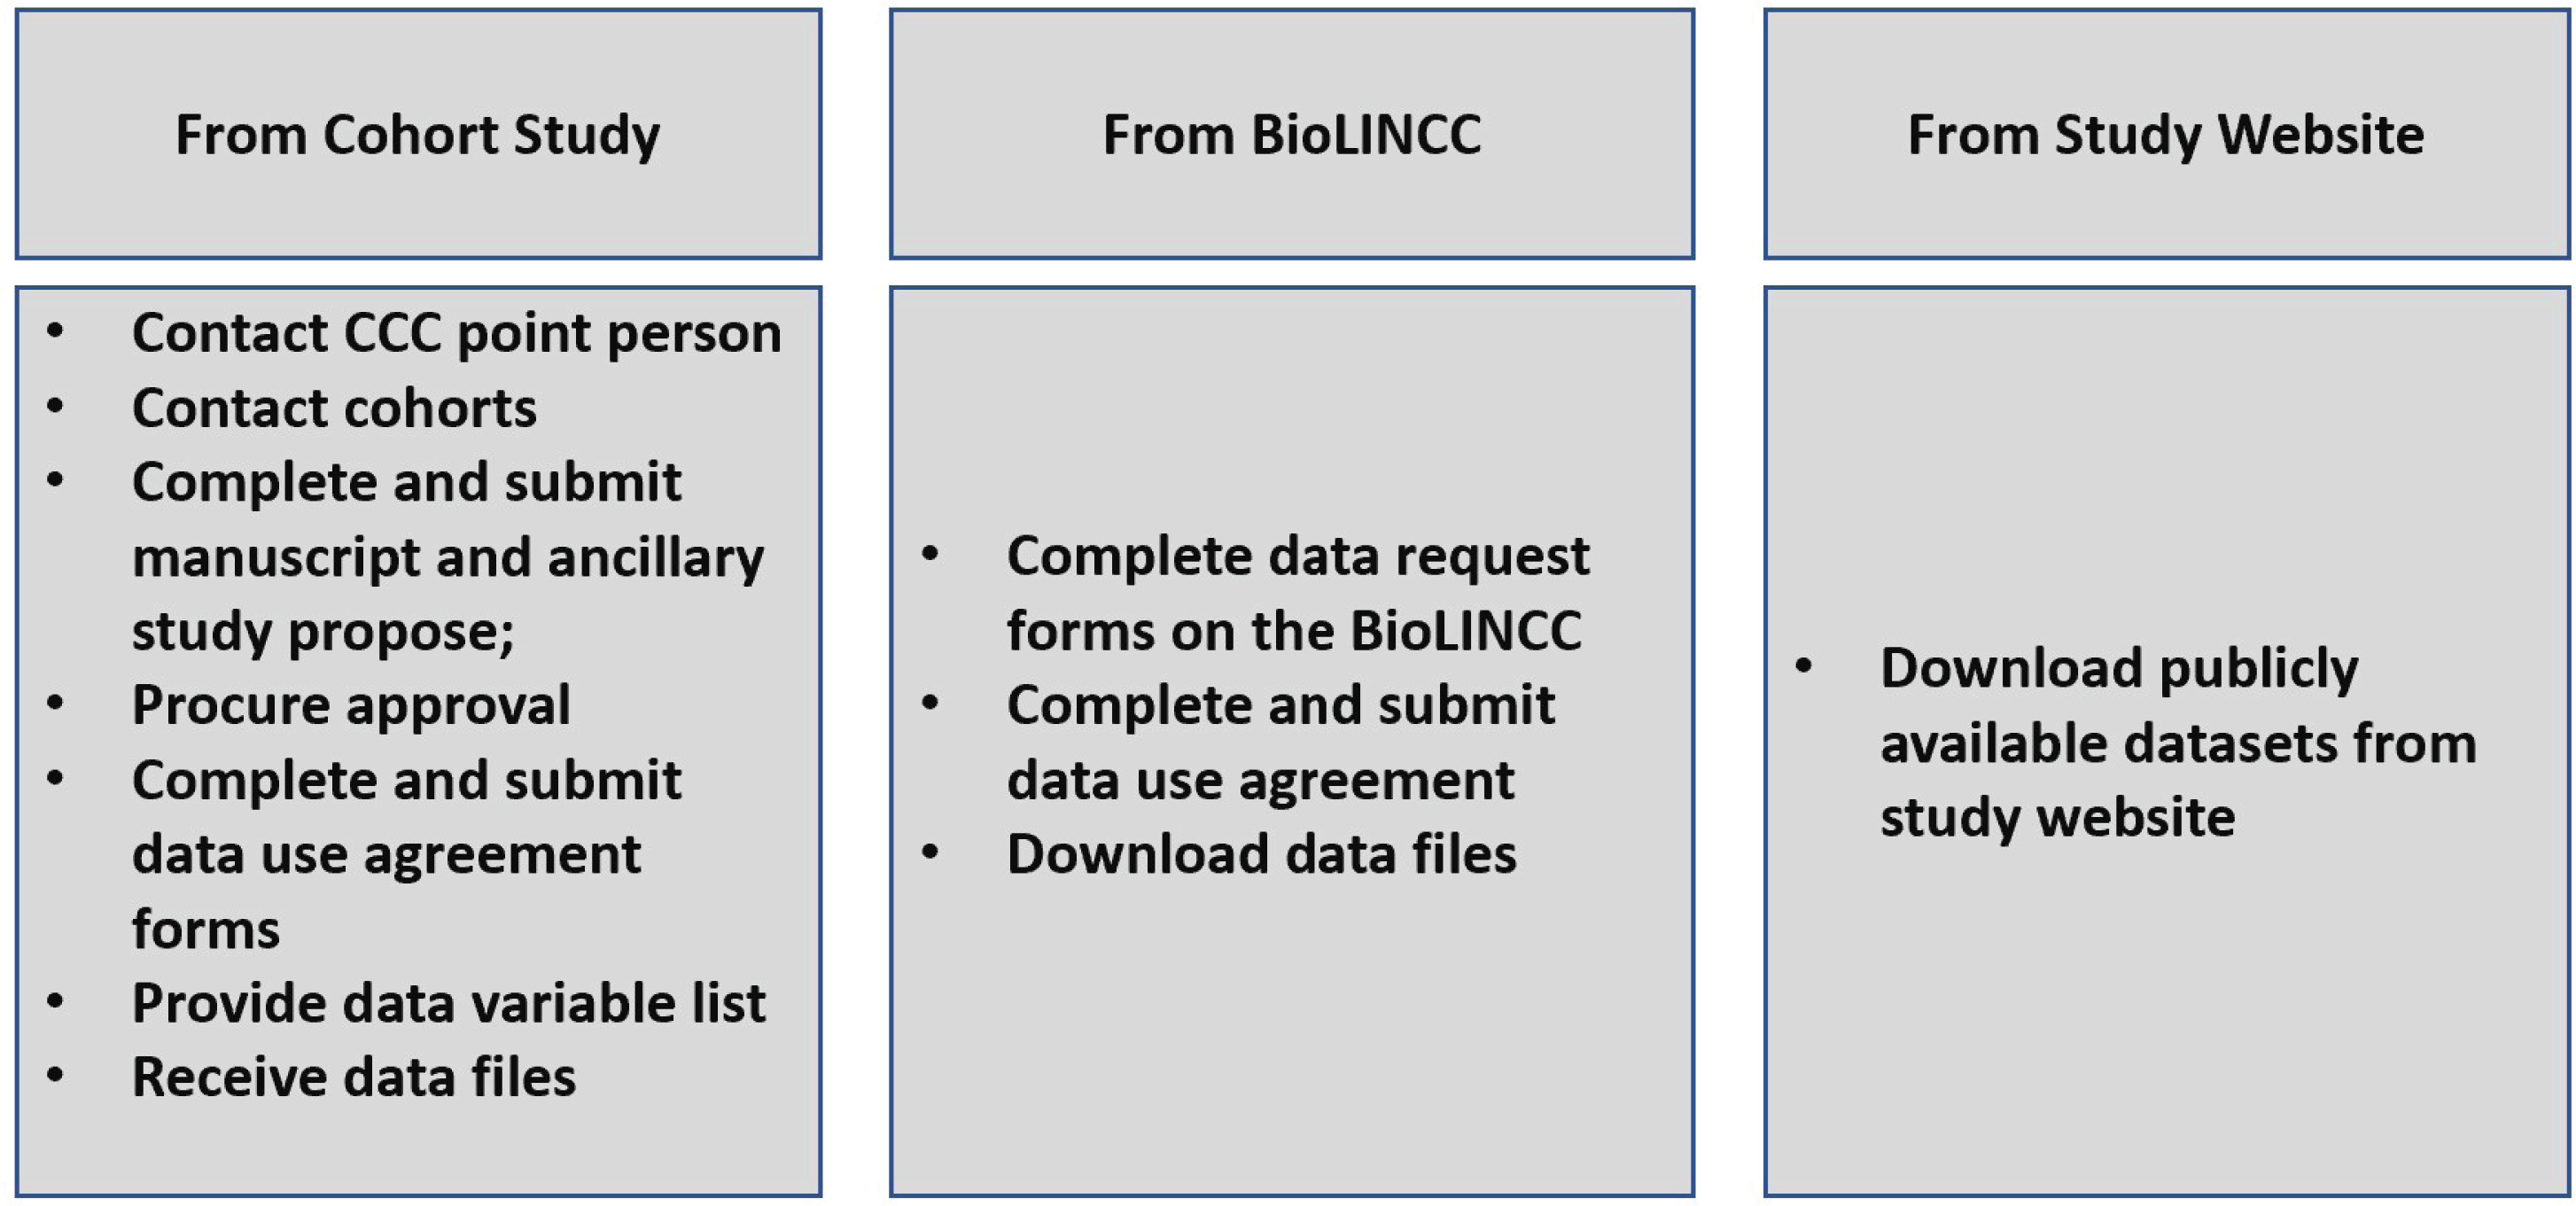
The data acquisition process consisted of establishing contact with the designated contact for each cohort, who then advised on the preferred mode of data transfer for the cohort. For most of the studies, the process entailed reaching out to the designated contact and subsequently submitting a study proposal which was then peer reviewed and ultimately approved by the cohort administrators or returned with request for changes. Upon approval of the proposal, data use agreements were completed and signed. Subsequently, data variable lists were sent to each study contact person. For studies like the FHS, data were obtained from the Biologic Specimen and Data Repository Information Coordinating Center (BioLINCC). Finally, several cohorts’ datasets were downloaded directly from the study website including the RBS and HEALTHABC. Upon transfer, datasets were stored in a secure encrypted cloud space (SafeDesktop) at the Johns Hopkins University School of Medicine. The process of data acquisition is summarized in Figure 2.
Data harmonization
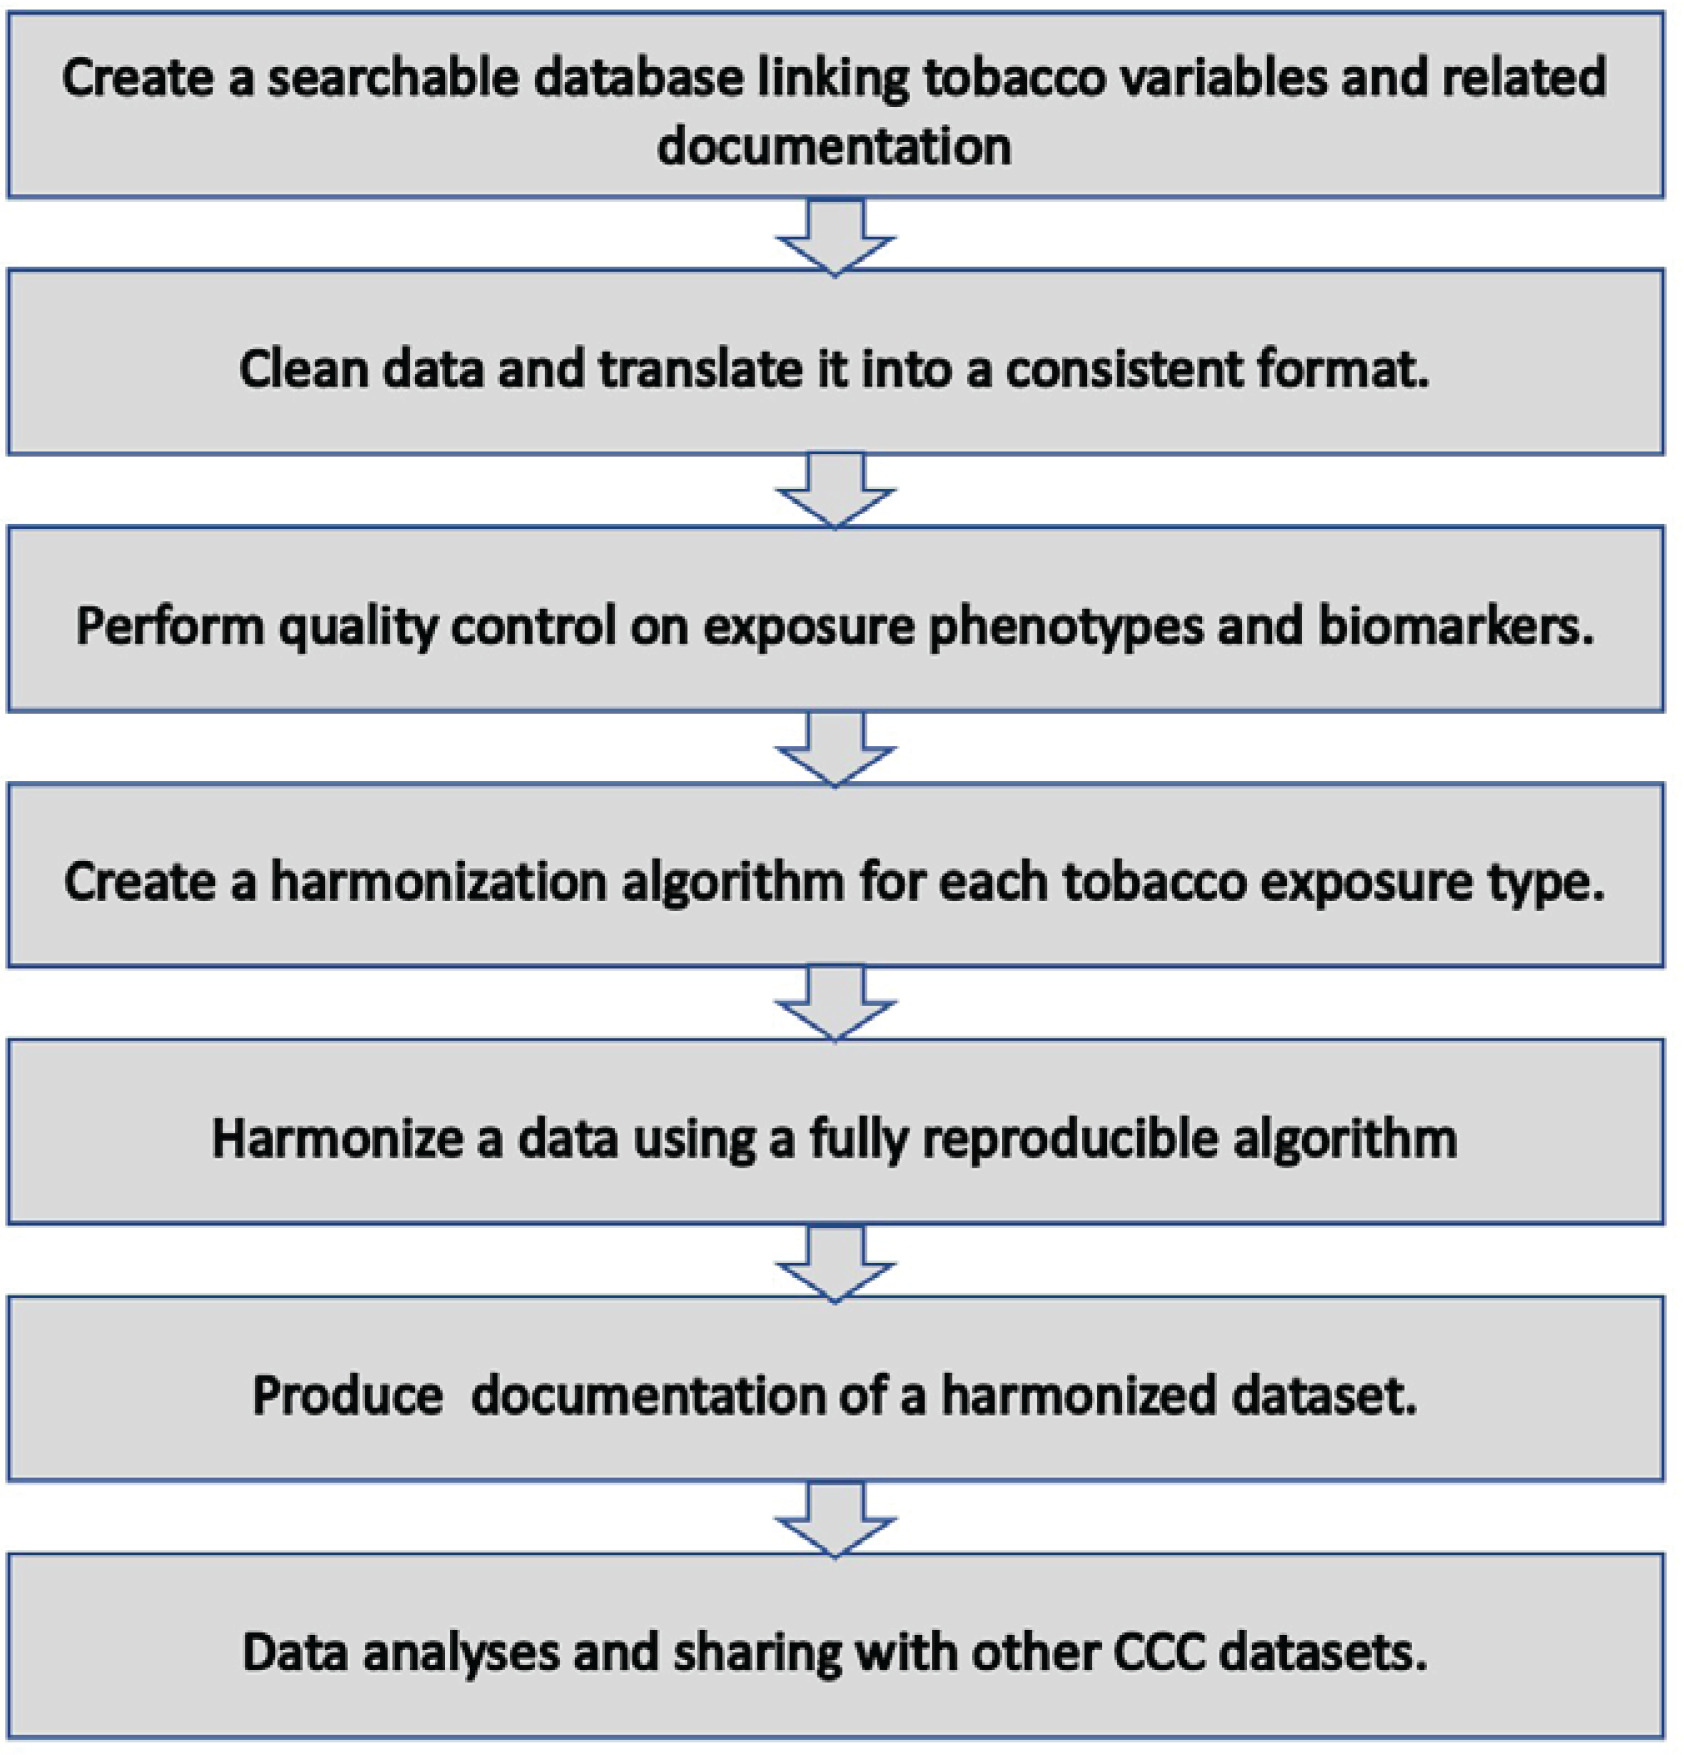
Data management and harmonization was conducted centrally at the Johns Hopkins University School of Medicine. Upon the receipt of datasets, data were checked for missing variables and any other inconsistencies following which the data providers for the respective study were queried. The decision to harmonize a variable was made if the given variable had been provided by more than one study. Our harmonization techniques were informed by Maelstrom, a McGill University-based group at the forefront of innovative methodological approaches to harmonization. Maelstrom published the first harmonization guidelines and pioneered tools to facilitate documentation, harmonization, and integration20. Additionally, we iteratively learned from the data harmonization methods used for the Trans-Omics for Precision Medicine (TOPMed) project21, an NHLBI-funded effort to couple whole-genome sequencing (WGS) and other Omics data (e.g. DNA methylation signature, RNA expression, and metabolite profiles) with molecular, behavioral, imaging, environmental, and clinical data. We also leveraged some of the techniques applied in the Lifetime Risk Pooling Project (LRPP)22, which combines 20 US community cohorts in a life course study, and the International Collaboration for a Life Course Approach to Women’s Reproductive Health and Chronic Disease Events (InterLACE)23, which harmonized 20 cohorts across ten countries. Figure 3 provides a simplified schematic framework of the current data harmonization process.
Statistical analysis
The association between smoking and CVD will be analyzed using survival analysis (COX proportional hazard model). In terms of studying the association of tobacco use transitions and CVD outcomes, our team has pioneered an approach that divides each participant’s experience into ‘person-trials’ reflecting tobacco use exposures accruing between each study visit. We have used this approach in one of our peer-reviewed publications16. This technique uses a variation of latent class mixed models (LCMM).
Preliminary results
The CCC-Tobacco includes approximately 322000 participants from 23 predominantly NHLBI-funded prospective cohort studies. The baseline characteristics of the study participants are presented in Table 2. The mean age ± SD at baseline examination for the combined cohort is 59.7 ± 11.8 years and about three-quarters of the participants are women (76%). CARDIA and FHS Offspring studies have relatively younger participants with mean age of 29.9 ± 3.6 and 36.8 ± 9.9 years, respectively, and the oldest is CHS with a mean age of approximately 72 years at baseline. The overall population is predominantly White (73.1%); the rest of the cohort is 15.6% African American, 6.4% Hispanic/Latino, 1.8% Asian, and 2.8% are American Indian or Alaskan Native participants. Almost all the participants enrolled in the FHS are White, and MESA is a racially and ethnically diverse group with 38.5% White, 27.8 % African American, 12% Chinese American, and 22% Hispanic/Latino participants. About one-fifth of the entire cohort (22.8%) completed high school education while 64.9% have at least some college education, with considerable variation across the cohorts.
Table 2
Baseline characteristics across the thirteen traditional cardiovascular cohorts in the Cross-Cohort Collaboration-Tobacco dataset (Part 1)
[i] *Data are presented as frequency and percentage n (%), mean ± standard deviation, or mean (range). ARIC: Atherosclerosis Risk in Communities Study. CARDIA: Coronary Artery Risk Development in Young Adults Study. CHS: Cardiovascular Health Study. DHS: Dallas Heart Study. FHS: Framingham Heart Study. HCHS/SOL: Hispanic Community Health Study/Study of Latinos. JHS Jackson Heart Study. MESA: Multi-Ethnic Study of Atherosclerosis. MRFIT: Multiple Risk Factor Intervention Trial. REGARDS: the Reasons for Geographic and Racial Differences in Stroke Study. SHS: the Strong Heart Study. BMI: body mass index. BP: blood pressure. HPL: hyperlipidemia. HTG: hypertriglyceridemia. LDL-C: low density lipoprotein cholesterol. HDL-C: high density lipoprotein cholesterol.
Table 2
Baseline characteristics across the ten non-cardiovascular cohorts in the Cross-Cohort Collaboration-Tobacco dataset (Part 2)
[i] *Data are presented as frequency and percentage n (%), mean ± standard deviation, or mean (range). BLSA: Baltimore Longitudinal Study of Aging. CRIC: Chronic Renal Insufficiency Cohort. ELSA-Brasil: the Brazilian Longitudinal Study of Adult Health GOLDN: Genetics of Lipid Lowering Drugs and Diet Network. Health ABC: the Health Aging and Body Composition Study. MrOS: the Osteoporotic Fractures in Men Study. RBS: Rancho Bernardo Study of Healthy Aging. SOF: Study of Osteoporotic Fractures. SWAN: the Study of Women’s Health Across the Nation. WHI: Women's Health Initiative. BMI: body mass index. BP: blood pressure. HPL: hyperlipidemia. HTG: hypertriglyceridemia. LDL-C: low density lipoprotein cholesterol; HDL-C: high density lipoprotein cholesterol.
With respect to comorbidities, 29.5% reported having a history of hyperlipidemia and 9.2% diabetes mellitus. Mean SBP and DBP are 127 ± 19 and 75 ± 11 mmHg in the overall population. Self-reported use of blood pressure medication and lipid-lowering medication are 22.4% and 12.5%, respectively.
Smoking status of participants in each of the 23 cohorts is categorized into never, former, and current, for both combustible cigarettes and non-cigarette tobacco products including cigar, pipe, smokeless tobacco, and e-cigarette (Table 3). Overall, 46330 (14.3%) participants reported current use of combustible cigarettes and 117424 (36.4%) reported former use. The prevalence of current cigarette smoking is highest in MRFIT (63.6%) and lowest in MrOS (3.4%). Baseline characteristics of the participants based on their combustible cigarette smoking status are shown in Table 4. The mean age of individuals who reported current smoking is 53.4 ± 12.2 years compared to 59.8 ± 12.4 years for those who never smoked, or 62.1 ± 9.9 years who formerly smoked. The proportion of women is highest for individuals who never smoked (82.6%), followed by those who formerly smoked (75.0%), and those who currently smoke (55.9%). The prevalence of alcohol use is higher among participants who currently smoke compared to never smoked (74.2% vs 50.4%). Similarly, the prevalence of hypertension (44.1% vs 39.9%) and hyperlipidemia (39.4% vs 27.4%) is higher in participants who currently smoke compared to never smoked. The prevalence of diabetes is comparable, approximately 11% in both groups. Furthermore, more detail on smoking status based on race and ethnicity has been provided in Supplementary file Table 2.
Table 3
Distribution (%) of traditional and non-traditional tobacco products across all the cohorts in the Cross-Cohort Collaboration-Tobacco dataset
| Participating cohorts | Traditional cigarette status | Cigar | Pipe | Smokeless tobacco | E-Cigarette* | F/U visits | ||||||||||
|---|---|---|---|---|---|---|---|---|---|---|---|---|---|---|---|---|
| Never | Former | Current | Never | Former | Current | Never | Former | Current | Never | Former | Current | Never | Former | Current | ||
| Cardiovascular specific cohorts | ||||||||||||||||
| ARIC | 41.6 | 32.1 | 26.2 | 93.4 | 4.8 | 1.8 | 90.0 | 8.2 | 1.7 | 91.2 | 5.3 | 3.3 | 7 | |||
| CARDIA | 57.2 | 14.1 | 28.6 | 96.0 | 3.4 | 0.6 | 97.8 | 1.9 | 0.2 | 96.7 | 2.3 | 0.8 | 92.9 | 3.9 | 3.2 | 7 |
| CHS | 46.5 | 41.5 | 12.0 | 10 | ||||||||||||
| DHS | 56.4 | 17.2 | 26.3 | 93.8 | 2.6 | 3.5 | 97.1 | 2.4 | 0.3 | 96.3 | 2.1 | 1.5 | 2 | |||
| FHS original | 44.0 | 9.8 | 46.1 | 8 | ||||||||||||
| FHS offspring | 34.9 | 19.8 | 45.2 | 94.9 | 0.7 | 4.4 | 95.6 | 0.7 | 3.6 | 9 | ||||||
| FHS 3rd generation | 57.1 | 27.3 | 15.5 | 98.4 | 0.5 | 1.1 | 99.2 | 0.7 | 0 | 94.6 | 3.9 | 1.5 | 2 | |||
| HCHS-SOL | 60.7 | 19.8 | 19.4 | 91.9 | 6.9 | 1.2 | 2 | |||||||||
| JHS | 85.5 | 1.2 | 13.3 | 97.4 | 1.5 | 1.1 | 98.6 | 1.0 | 0.3 | 97.0 | 1.2 | 1.6 | 2 | |||
| MESA | 50.3 | 36.6 | 13.1 | 90.6 | 7.4 | 1.9 | 91.6 | 7.7 | 0.6 | 98.1 | 1.3 | 0.4 | 99.3 | 0.4 | 0.2 | 6 |
| SHS | 29.0 | 33.0 | 37.9 | 6 | ||||||||||||
| Non cardiovascular specific cohorts | ||||||||||||||||
| BLSA | 60 | 5.6 | 34.1 | 90.9 | 7.2 | 1.9 | 88.1 | 11.5 | 0.3 | 7 | ||||||
| CRIC | 38.6 | 46.9 | 14.5 | 78.0 | 19.0 | 3.0 | 84.1 | 12.8 | 3.0 | 18 | ||||||
| ELSA-Brasil | 56.9 | 30.0 | 13.1 | 4 | ||||||||||||
| GOLDN | 70.7 | 21.9 | 7.4 | 1 | ||||||||||||
| Health ABC | 54.8 | 34.8 | 10.4 | 10 | ||||||||||||
| MRFIT | 14.4 | 21.8 | 63.6 | 10 | ||||||||||||
| MrOS | 37.5 | 59.0 | 3.4 | 10 | ||||||||||||
| RBS | 45.2 | 32.3 | 22.4 | 12 | ||||||||||||
| REGARDS | 45.2 | 40.1 | 14.6 | 88.4 | 9.4 | 2.1 | 98.0 | 2 | 2 | |||||||
| SOF | 60.4 | 29.6 | 10 | 7 | ||||||||||||
| SWAN | N/A | N/A | N/A | 15 | ||||||||||||
| WHI | 51.0 | 42.0 | 6.9 | 9 | ||||||||||||
| Total estimated prevalence (N) | 160000 | 117000 | 47000 | 43000 | 2400 | 1000 | 40000 | 2000 | 500 | 58000 | 4000 | 1400 | 37000 | 1000 | 600 | |
ARIC: Atherosclerosis Risk in Communities Study. CARDIA: Coronary Artery Risk Development in Young Adults Study. CHS: Cardiovascular Health Study. DHS: Dallas Heart Study. FHS: Framingham Heart Study. HCHS/SOL: Hispanic Community Health Study/Study of Latinos. JHS Jackson Heart Study. MESA: Multi-Ethnic Study of Atherosclerosis. MRFIT: Multiple Risk Factor Intervention Trial. REGARDS: the Reasons for Geographic and Racial Differences in Stroke Study. SHS: the Strong Heart Study. BLSA: Baltimore Longitudinal Study of Aging. CRIC: Chronic Renal Insufficiency Cohort. ELSA-Brasil: the Brazilian Longitudinal Study of Adult Health GOLDN: Genetics of Lipid Lowering Drugs and Diet Network. Health ABC: the Health Aging and Body Composition Study. MrOS: the Osteoporotic Fractures in Men Study. RBS: Rancho Bernardo Study of Healthy Aging. SOF: Study of Osteoporotic Fractures. SWAN: the Study of Women’s Health Across the Nation. WHI: Women's Health Initiative.
Table 4
Baseline characteristics across combustible cigarette smoking status in the Cross-Cohort Collaboration-Tobacco dataset
For the non-cigarette tobacco products, the prevalence of current use of cigar, pipe, and smokeless tobacco, in the overall population is 2.1% (991), 1.2% (523), and 2.2% (1375), respectively. Data on e-cigarette use is available for FHS 3rd generation, MESA, CARDIA, REGARDS, and HCHS/SOL with 191, 31, 219, 331, and 932 users (current and former), respectively. Table 5 shows the prevalence of non-cigarette tobacco product use status stratified by cigarette smoking status. The prevalence of cigars, pipes, and smokeless tobacco use is 2.5%, 1.2%, and 2.0%, respectively, among participants who currently smoke combustible cigarettes. The prevalence among participants who formerly smoked cigarettes is 4.5% for cigar, 4.5% for pipe, and 7.3% for smokeless tobacco use. Among individuals who had never smoked cigarettes, the prevalence of each of the non-cigarette tobacco products is <2%.
Table 5
Non-traditional tobacco use status across combustible cigarette smoking status in the Cross-Cohort Collaboration-Tobacco dataset
Inflammatory markers, a priority area for CCC-Tobacco, were evaluated at baseline and during follow-up. The number of measurements of each inflammatory marker is given in Supplementary file Table 3.
DISCUSSION
The CCC is a research initiative that involves pooling data from several existing prospective cohort studies in the US and Brazil to create a large and diverse dataset capable of leveraging the power in addressing questions that would be unanswerable or otherwise underpowered using a single cohort. The CCC’s core focus is on harmonizing data collected from the various studies to ensure consistency and reliability of the findings. The CCC-Tobacco dataset will enable the examination of the association of traditional and non-traditional tobacco product use with subclinical and clinical CVD in adults, with a particular focus on understudied minority groups. Moreover, because of the large sample size, the cohort will make possible for the first time to study the differential impact of smoking as well as the health effects of non-traditional tobacco products in different population subgroups.
The CCC-Tobacco is significant for several reasons. Despite the rise in usage of non-traditional tobacco products such as cigars, pipes, e-cigarettes, and smokeless tobacco, well-powered studies on their long-term impact on cardiovascular health in a wellcharacterized population are limited. Furthermore, to the best of our knowledge, no prior study has systematically explored the relationship between cigars, pipes, and smokeless tobacco and multiple domains of subclinical markers of CVD, as well as the extent to which cardiovascular outcomes are caused by these non-cigarette tobacco products and mediated by these subclinical markers, and how they may vary among different subgroups. The CCC-Tobacco data will enable us to identify new biomarkers of cardiovascular harm associated with combustible cigarette use and the extent to which these biomarkers mediate cardiovascular risk. Additionally, using the CCC-Tobacco dataset, which has extensive data on non-cigarette tobacco products, we will be able to link the use of non-cigarette tobacco products to already established markers of cardiovascular harm including markers of subclinical inflammation (high sensitivity C-reactive protein and interleukin-6) and novel markers such as CAC24-29.
The FDA considers the study of the health effects of alternative tobacco products using longitudinal data as a top research priority30. Our work will help elucidate the health effects of these non-cigarette tobacco products with respect to the hypothesized risk continuum31-33. Therefore, our work with the CCC-Tobacco could prove vital to the regulatory authority of the FDA and other policy initiatives and recommendation regarding non-cigarette tobacco products in a way that is deemed appropriate for the protection of public health. The importance of addressing CVD as a major contributor to morbidity and mortality is paramount to improving public health. The approach and descriptive findings presented here demonstrate the unique strength of the CCC-Tobacco to provide crucial information that can inform public health strategies and policies regarding non-cigarette tobacco product regulation.
Challenges and limitations
While this article seeks to provide insight into the logistical process of data acquisition and harmonization in addition to an insight into the characteristics of the pooled dataset, we also discuss challenges in our work. Challenges encountered during the early phases include those associated with establishing contact with study personnel and keeping study collaborators engaged. Additionally, the lack of an existing streamlined process for data transfer and completed mandatory data-use contracts led to a largely unpredictable workflow resulting in delays. On a few occasions, following the approval process, datasets were delivered to the processing site in inaccessible formats. Additionally, the CCC-Tobacco database has some limitations. First, the observational study design leads to the potential for residual confounding and limitations in the ability to establish causal relations. Secondly, age distributions limit the ability to generalize to children and young adults smoking patterns and associations. Third, despite the large sample size, the number of individuals using non-traditional tobacco products was still quite modest. Lastly, the studies did not routinely collect data on individuals who were sexual or gender minorities or who used a variety of illicit drugs.
Future perspectives
We envision that the experience and challenges reported in establishing the CCC-Tobacco will serve as a learning opportunity for other cross-cohort work and provide a potential framework for additional future cross collaboration and data sharing between NHLBI studies. Our dataset will potentially serve as an epidemiological resource for the tobacco research community at large. Our dataset will serve as a rich epidemiological resource for other working groups in the CCC and the research community at large. Our approach also provides considerable room for expansion of the current dataset. CCC-Tobacco can be easily expanded to include other risk factors and cohorts, including advanced biomarkers and Omics measures, and results can be compared with other consortia like the Emerging Risk Factors Collaboration34,35.
Furthermore, we plan to continue to harmonize all tobacco use at each additional visit beyond the baseline study visit of each cohort in order to provide unprecedented longitudinal tobacco use data to expand our analysis into the study of tobacco use transitions (product switching and changes in use intensity) and their relative association with subclinical and clinical CVD. Lastly, cohorts (MESA, FHS 3rd generation, CARDIA, REGARDS, and HCHS-SOL) starting to collect data on new tobacco products such as e-cigarette at follow-up, will expand our knowledge regarding the health effects of these products.
CONCLUSIONS
The CCC-Tobacco dataset, with its large sample size, long-term follow up, diverse study population, and encompassing multiple subclinical features and clinical CVD events, aims to expand our knowledge regarding traditional and non-traditional tobacco products and their association with subclinical and clinical CVD. We aim to identify novel biomarkers of cardiovascular harm associated with combustible cigarette and non-cigarette tobacco product use36. The large sample size of women and other underrepresented groups allows for research in these historically understudied groups. Future iterations of this project, by providing data on long-term tobacco use and tobacco produce use transitions, could provide important information on how changes in tobacco use patterns influence markers of subclinical cardiovascular injury and CVD risk. The findings from the CCC-Tobacco will therefore provide the FDA with new and pertinent knowledge that would inform regulation of non-cigarette tobacco products. Ultimately, our aim is to obtain new information regarding the cardiovascular impact of non-traditional tobacco products and to deliver actionable results to the tobacco regulatory science community.