

INTRODUCTION
Cigarette smoking remains a major preventable cause of disease and premature mortality worldwide1. Continued smoking in later life is particularly consequential because cumulative tobacco exposure often coexists with chronic disease, functional vulnerability, and social disadvantage2-4. Among older adults in China, smoking is associated with sex, education, residence, living arrangements, and other social and demographic characteristics3,5,6. These patterns show that later-life smoking occurs within a social context, but they do not imply that individual factors are unimportant.
The relationship between social connection and smoking is complex. Social isolation and loneliness have been associated with persistent smoking and reduced cessation, while smoking may itself contribute to subsequent social isolation7-9. Social activities also differ in location, duration, membership, and prevailing behavioral norms. An activity involving repeated peer contact may create different exposure to smoking cues from an organized club or a helping activity. Collapsing these settings into one measure can therefore conceal activity-specific associations.
The Chinese setting is relevant because cigarettes can function as objects of sharing and gifting within social exchange10,11. Longitudinal evidence also links pro-smoking descriptive and injunctive norms with higher smoking levels and slower smoking reduction12. These practices provide a plausible, but untested, explanation for differences across activity settings.
To our knowledge, direct evidence remains limited. A longitudinal CHARLS study of ever smokers aged 45–80 years with smoking-related morbidity found that mahjong, chess, or card playing was associated with persistent smoking, whereas community-organized physical activities were inversely associated13. A separate study using the Chinese Longitudinal Healthy Longevity Survey linked mahjong participation with smoking status and cigarette consumption14. Neither study compared the full Wave 5 activity inventory across the same three smoking outcomes in a general population aged ≥60 years.
Using CHARLS 2020, we examined cross-sectional associations between the same eight social activity indicators and three smoking outcomes: current versus never smoking, daily cigarette count among current smokers, and former versus current smoking among ever smokers. Examining the same activity set across these outcomes allowed us to assess whether an association with smoking status also appeared for smoking intensity or former-smoking status.
The primary objective was to determine whether specific activity types were associated with current versus never smoking when all eight activities were modeled together. Secondary objectives were to compare these associations with daily cigarette count and former versus current smoking, control the false discovery rate within each outcome, and assess prespecified sensitivity analyses.
METHODS
Study design, setting, and participants
This study was a cross-sectional secondary analysis of the 2020 Wave 5 of the China Health and Retirement Longitudinal Study (CHARLS). CHARLS is a nationally representative longitudinal survey of Chinese adults aged ≥45 years and their spouses, but the present analysis used one wave and therefore did not use its longitudinal structure15,16. The 2020 wave included 19395 respondents. Eligibility required age ≥60 years and classifiable smoking status. Of 10654 age-eligible respondents, 23 had unclassifiable smoking status, leaving 10631 participants: 2614 current, 1742 former, and 6275 never smokers.
Outcome-specific samples also required complete exposure and covariate data. The current-versus-never analysis included 7804 of 8889 eligible current or never smokers from 444 communities; 1085 (12.2%) were excluded for incomplete activity or covariate data. The cigarette-consumption analysis included 2376 of 2614 current smokers (90.9%) from 427 communities. The former-versus-current analysis included 3871 of 4356 ever smokers (88.9%) from 440 communities. Figure 1 shows eligibility and outcome-specific exclusions. Former smokers were not eligible for the current-versus-never comparison and were not counted as missing from that analysis.
Figure 1.
Participant selection and three outcome-specific complete-case samples among Chinese adults aged ≥60 years, a cross-sectional secondary analysis of CHARLS 2020 (age-eligible N=10654; classifiable smoking status N=10631)
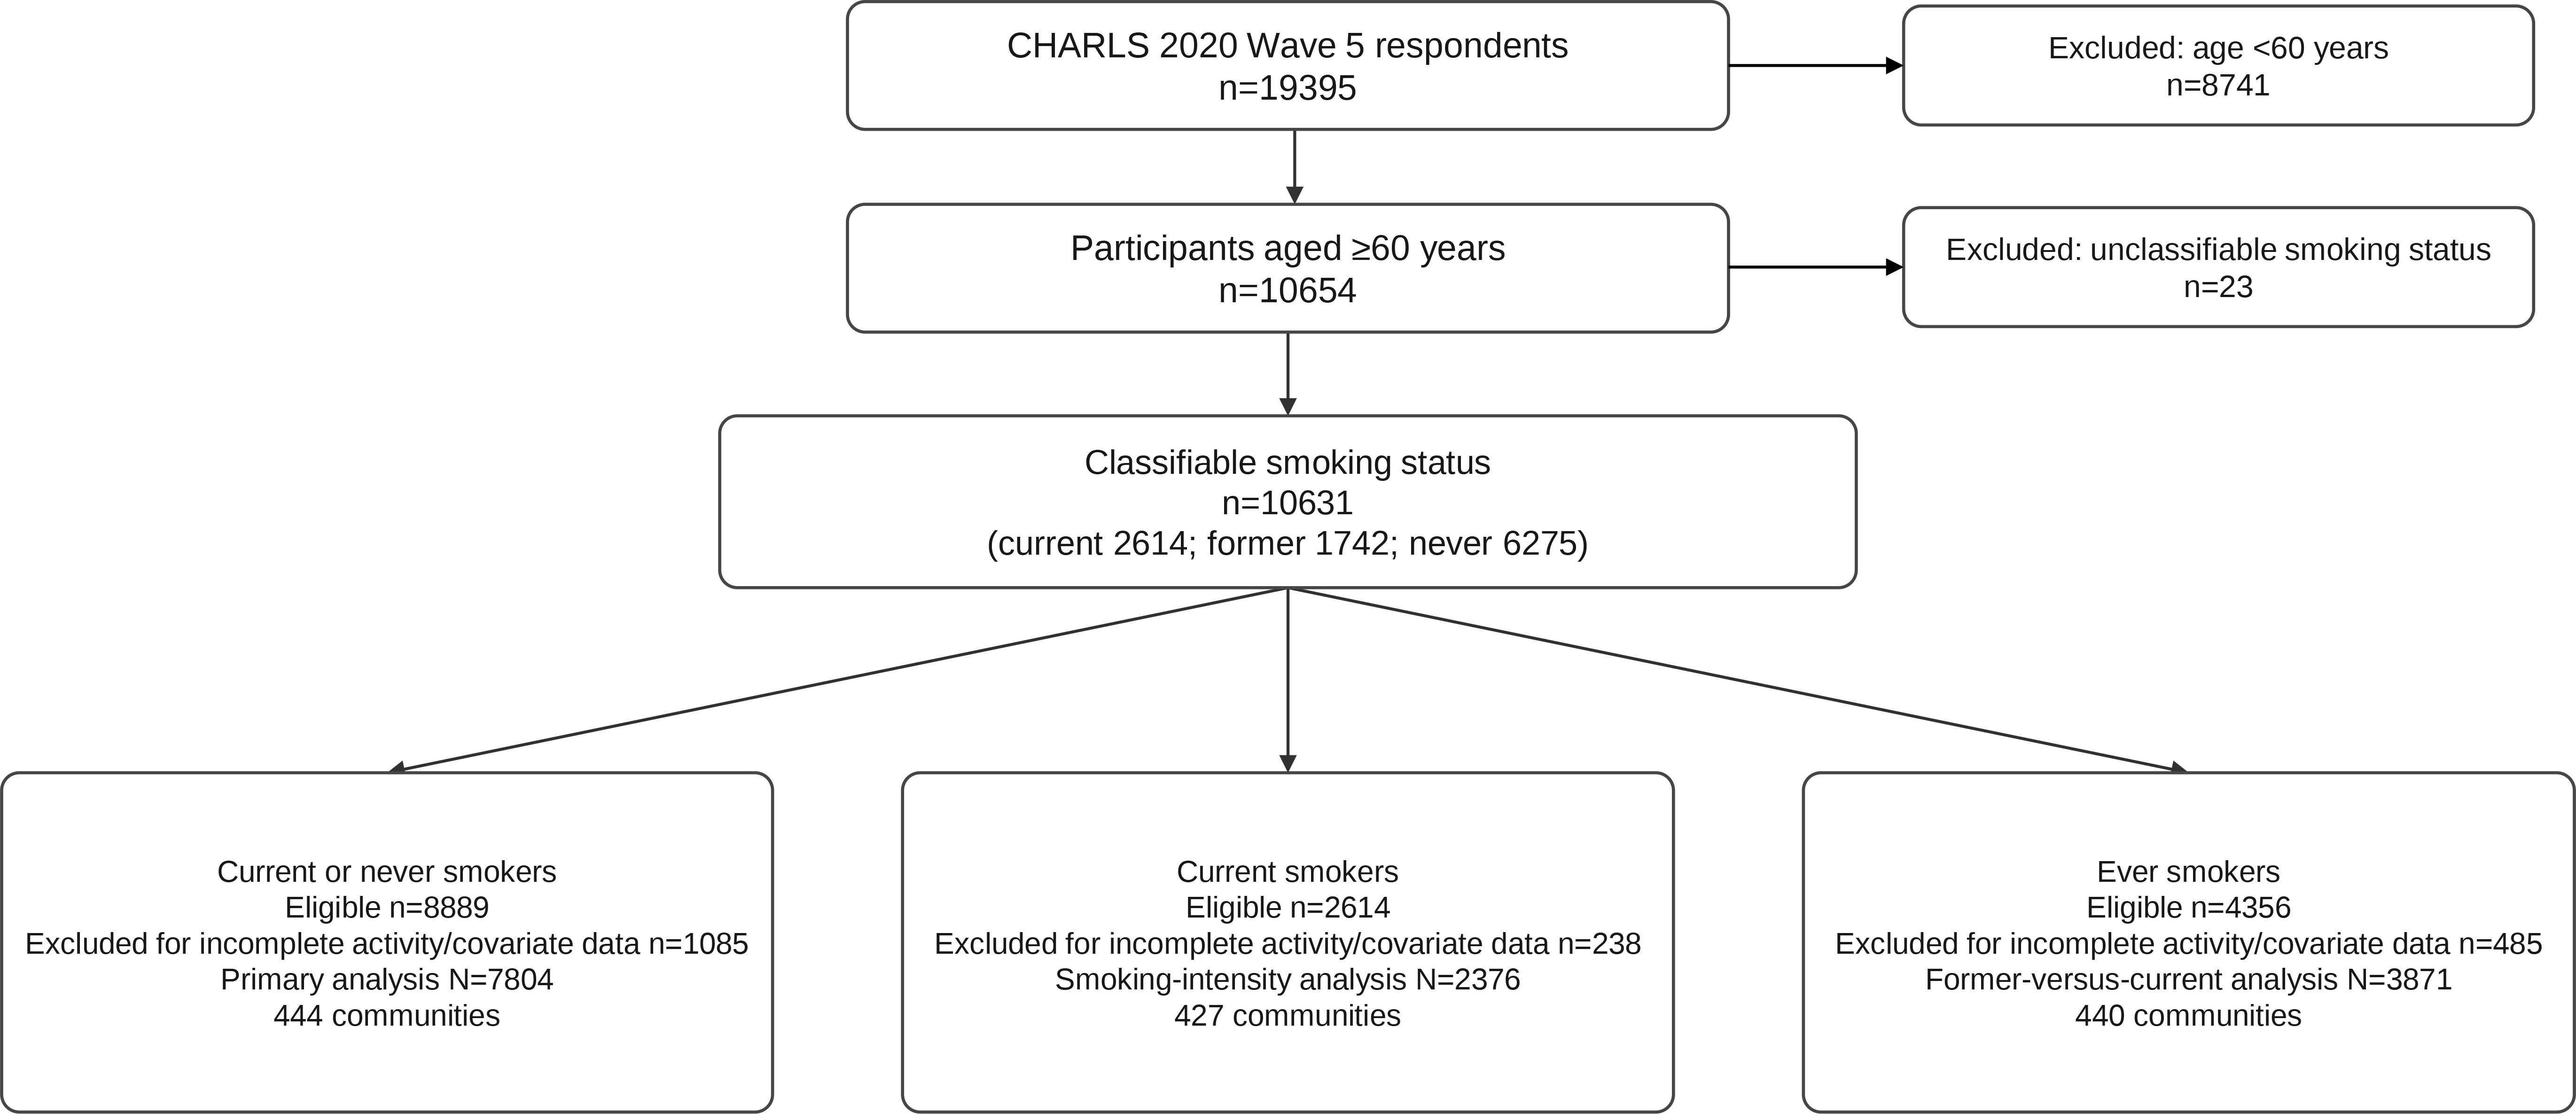
CHARLS: China Health and Retirement Longitudinal Study. Former smokers were ineligible for the current-versus-never analysis; exclusions for incomplete activity/covariate data were outcome-specific.
Measures
Smoking outcomes
Smoking status was constructed from CHARLS items DA046 and DA04717. DA046 asked, ‘Have [you] ever chewed tobacco, smoked a pipe, smoked self-rolled cigarettes, or smoked cigarettes/cigars?’ (yes/no). DA047 asked whether the respondent ‘still [had] the habit or [had] totally quit’ (still have/quit/never smoked). Respondents reporting ‘still have’ were classified as current smokers, those reporting ‘quit’ as former smokers, and those reporting ‘never smoked’ or denying lifetime tobacco use as never smokers. The primary binary outcome compared current with never smoking. DA050_1 asked current smokers, ‘In one day about how many cigarettes do you consume now?’. The response was analyzed as daily cigarette count. DA049 asked, ‘At what age or in what year did [you] successfully quit smoking this time?’. Respondents reported either their age at quitting or the calendar year of quitting. Approximate years since cessation were calculated as current age minus age at quitting or 2020 minus calendar year of quitting; unknown and invalid values were treated as missing. Time since cessation was described but was not included in the regression models.
The outcomes were analyzed separately because they represent different dimensions of tobacco use. Current versus never smoking captures status, daily cigarette count captures consumption among current smokers, and former versus current smoking distinguishes cessation status among ever smokers. The last measure is cross-sectional and does not establish when or why cessation occurred.
Social activity types
Social activity was assessed with the predefined, select-all-that-apply CHARLS item DA038: ‘Have [you] done any of these activities in the last month?’17. The eight response options were interacting with friends; playing mahjong, chess, or cards or going to a community club; helping family, friends, or neighbors who did not live with the respondent; going to a sport, social, or other club; taking part in a community-related organization; voluntary or charity work, including care for a non-co-resident sick or disabled adult; attending an educational or training course; and other social activity. ‘None of the above’ was also available.
Each activity was coded as a binary indicator (endorsed versus not endorsed). Because the indicators were non-mutually-exclusive, respondents could endorse several activities. All eight indicators entered each regression model simultaneously, so the coefficient for one activity was estimated conditional on the other seven. The combined item was retained exactly as measured; its association cannot be attributed to any one component. Potential overlap with the ‘going to a sport, social, or other club’ and community-organization items was assessed using multicollinearity diagnostics.
Health measures and covariates
Health measures comprised a count of 15 physician-diagnosed conditions: hypertension; dyslipidemia; diabetes or high blood sugar; cancer or malignant tumor; chronic lung disease; liver disease; heart disease; stroke; kidney disease; stomach or other digestive disease; emotional, nervous, or psychiatric problems; memory-related disease; Parkinson’s disease; arthritis or rheumatism; and asthma17. Basic activities of daily living (ADL) impairment was present when a respondent reported any difficulty with dressing, bathing, eating, transferring, toileting, or continence. Self-rated health used the five DA001 categories (very good, good, fair, poor, very poor). DA030 nighttime sleep was the respondent’s average hours of actual sleep per night during the past month and was modeled continuously.
Covariates were coded as follows: age, sex (men, women); education (elementary school or lower, junior middle school, senior high or vocational school, college or higher); marital status (married and co-residing, married but temporarily living apart, separated, divorced, widowed, never married); residence (rural/urban); hukou (agricultural, non-agricultural, unified resident/no hukou); and current alcohol use (any drinking in the past year versus none, from DA051)17. Categorical variables were entered as indicator terms. These covariates were selected a priori because socioeconomic position, household context, health, and alcohol use are associated with both participation and smoking in later life2-4,6. Family structure and physical activity were descriptive variables and were not included in the primary adjustment set.
Statistical analysis
Descriptive and primary analyses
Continuous variables are reported as means with standard deviations and categorical variables as frequencies and percentages. Descriptive comparisons across smoking-status groups used one-way analysis of variance for continuous variables and Pearson chi-squared tests for categorical variables. These p-values describe the sample and were not adjusted for multiple testing.
Four community-clustered logistic models estimated current versus never smoking. Model 1 included all eight activity indicators, so its activity estimates were mutually adjusted but not adjusted for non-activity covariates. Model 2 added age and sex. Model 3 added education level, marital status, residence, and hukou. Model 4 further added chronic-condition count, ADL impairment, self-rated health, sleep duration, and alcohol use. Model 1 estimates are reported as ORs; Models 2–4 are reported as adjusted odds ratios (AORs), each with 95% confidence intervals (CIs). Non-participation in each activity was the reference category.
Multicollinearity was assessed in the fully adjusted current-versus-never design matrix by regressing each activity indicator on all remaining predictors and calculating variance inflation factors (VIFs). A VIF >5 was prespecified as indicating potentially important multicollinearity.
Secondary outcomes and multiple testing
Daily cigarette count among current smokers was modeled using negative binomial regression with community-clustered robust standard errors and reported as adjusted incidence rate ratios (AIRRs). Former versus current smoking among ever smokers was modeled using community-clustered logistic regression and reported as AORs. For each outcome, the inferential family comprised the eight activity coefficients. Benjamini-Hochberg q-values were calculated separately within each outcome (eight tests per family) because the outcomes had different populations, model scales, and substantive interpretations; a single 24-test correction was not used18. All activity coefficients were retained irrespective of significance.
The negative binomial specification was evaluated against Poisson regression using the estimated dispersion parameter and a likelihood-ratio test. Sixty of 2376 current smokers (2.5%) reported zero cigarettes/day. Because a separate structural-zero process was not prespecified and zero counts were uncommon, these observations were retained in the primary model; they may reflect intermittent smoking or discordance between the smoking-status and consumption responses. A sensitivity analysis excluded them.
Sensitivity analyses and design considerations
All outcome models used complete cases. Multiple imputation was not prespecified and was not added post hoc because it would require additional modeling assumptions for missing self-rated-health and sleep data across three outcome-specific samples. Instead, we quantified variable-level missingness and compared included with excluded participants; the resulting potential for selection bias is addressed in the Discussion. Sensitivity analyses for the association between the combined item and daily cigarette count included restriction to men, exclusion of zero counts, exclusion of counts above 60 cigarettes/day, additional CES-D-10 adjustment, a community fixed-effects model of log cigarette count, and an ordinal frequency trend. For this trend, non-participation was coded 0, and participation frequency was coded 1 for ‘not often’, 2 for ‘almost every week’, and 3 for ‘almost every day’. All tests were two-sided.
Sex modification was assessed for the two main activity items in the fully adjusted current-versus-never model by simultaneously entering separate product terms between sex and each activity item. Sex-stratified models retained the full adjustment set except sex. Interaction p-values and sex-stratified AORs are reported in Supplementary file Table S4.
We summarized variable-level missingness before complete-case exclusion. For the primary current-versus-never analysis, included and excluded eligible participants were compared using descriptive statistics, two-sided tests, and absolute standardized differences. Detailed results are reported in Supplementary file Tables S1 and S2.
The analytic file did not contain the separate 2020 sampling-weight file or explicit stratification variables. We therefore report unweighted sample associations. Community-clustered standard errors account for within-community dependence but do not reproduce the CHARLS complex survey design16. If activity participation and smoking differed jointly by sampling or non-response probabilities, the unweighted estimates could be biased upward or downward; the direction cannot be determined from the analytic file. Results should not be interpreted as nationally weighted prevalence or population-average effects.
RESULTS
Participant characteristics
Table 1 describes the 10631 adults with classifiable smoking status. Current and former smokers were predominantly men (89.6% and 89.8%, respectively), whereas 80.3% of never smokers were women. Current smokers were younger and more often reported alcohol use and vigorous physical activity. Former smokers were older and had the highest mean chronic-condition count. Never smokers were more often widowed and more frequently reported moderate physical activity.
Table 1.
Demographic, socioeconomic, health, behavioral, and social activity characteristics by smoking status among Chinese adults aged ≥60 years with classifiable smoking status, a cross-sectional secondary analysis of CHARLS 2020 (N=10631)
Any social activity was reported by 46.0% of current, 41.8% of former, and 43.4% of never smokers (p=0.014). The combined ‘playing mahjong, chess, or cards or going to a community club’ item was reported by 20.7% of current and 11.0% of never smokers. Among current and never smokers, current-smoking prevalence was 43.9% (542/1234) among participants in this item and 27.1% (2072/7655) among non-participants, an unadjusted prevalence difference of 16.8 percentage points. For the ‘going to a sport, social, or other club’ item, current-smoking prevalence was 14.9% (73/489) among participants and 30.3% (2541/8400) among non-participants, an unadjusted prevalence difference of -15.3 percentage points. These descriptive differences were not adjusted for covariates and do not have a causal interpretation.
Before complete-case exclusion, 23 of 10654 age-eligible respondents (0.2%) had unclassifiable smoking status. Among the 10631 respondents with classifiable status, missingness was highest for self-rated health (1177; 11.1%) and night-time sleep (288; 2.7%); residence was missing for 12 (0.1%) and ADL impairment for 1 (<0.1%). The activity indicators and other adjustment variables had no missing values (Supplementary file Table S1).
Compared with the 1085 excluded eligible participants, the 7804 included participants were younger (mean 68.15 vs 73.76 years), more often men (41.0% vs 35.2%), current smokers (30.4% vs 21.9%), and participants in any social activity (46.2% vs 29.4%), and less often had ADL impairment (27.7% vs 42.1%). The largest absolute standardized differences were for age (0.71), any social activity (0.35), ADL impairment (0.31), the combined item (0.25), and the ‘going to a sport, social, or other club’ item (0.20) (Supplementary file Table S2).
Activity-specific associations with current smoking
VIFs for the eight activity indicators ranged from 1.01 to 1.14, indicating no material multicollinearity (Supplementary file Table S3A). Table 2 presents the sequential models. For the combined item, the mutually activity-adjusted OR was 2.15 (95% CI: 1.88–2.46; p<0.001). After adjustment for age and sex, the AOR was 1.73 (95% CI: 1.44–2.08; p<0.001). The fully adjusted AOR was 1.78 (95% CI: 1.48–2.14; p<0.001).
Table 2.
Sequential associations of selected social activity items with current versus never smoking among Chinese adults aged ≥60 years, a cross-sectional secondary analysis of CHARLS 2020 (complete-case N=7804; 444 communities)
[i] All models included the eight activities simultaneously. M1 estimates are mutually activity-adjusted ORs. M2–M4 estimates are AORs: M2 added age and sex. M3 added education, marital status, residence, and hukou. M4 added chronic conditions, ADL impairment, self-rated health, sleep, and alcohol use. Non-participation was the reference. AOR: adjusted odds ratio. CI: confidence interval. OR: odds ratio.
Participation in the ‘going to a sport, social, or other club’ item was inversely associated with current versus never smoking in all four models. The fully adjusted estimate was AOR=0.57 (95% CI: 0.42–0.77; p<0.001). Both fully adjusted activity coefficients remained below the FDR threshold (q<0.001 for the combined item; q=0.001 for the ‘going to a sport, social, or other club’ item). None of the other six activity coefficients met the FDR threshold (Table 3 and Figure 2).
Figure 2.
Fully adjusted associations of eight social activity items with current versus never smoking among Chinese adults aged ≥60 years, a cross-sectional secondary analysis of CHARLS 2020 (N=7804; 444 communities)
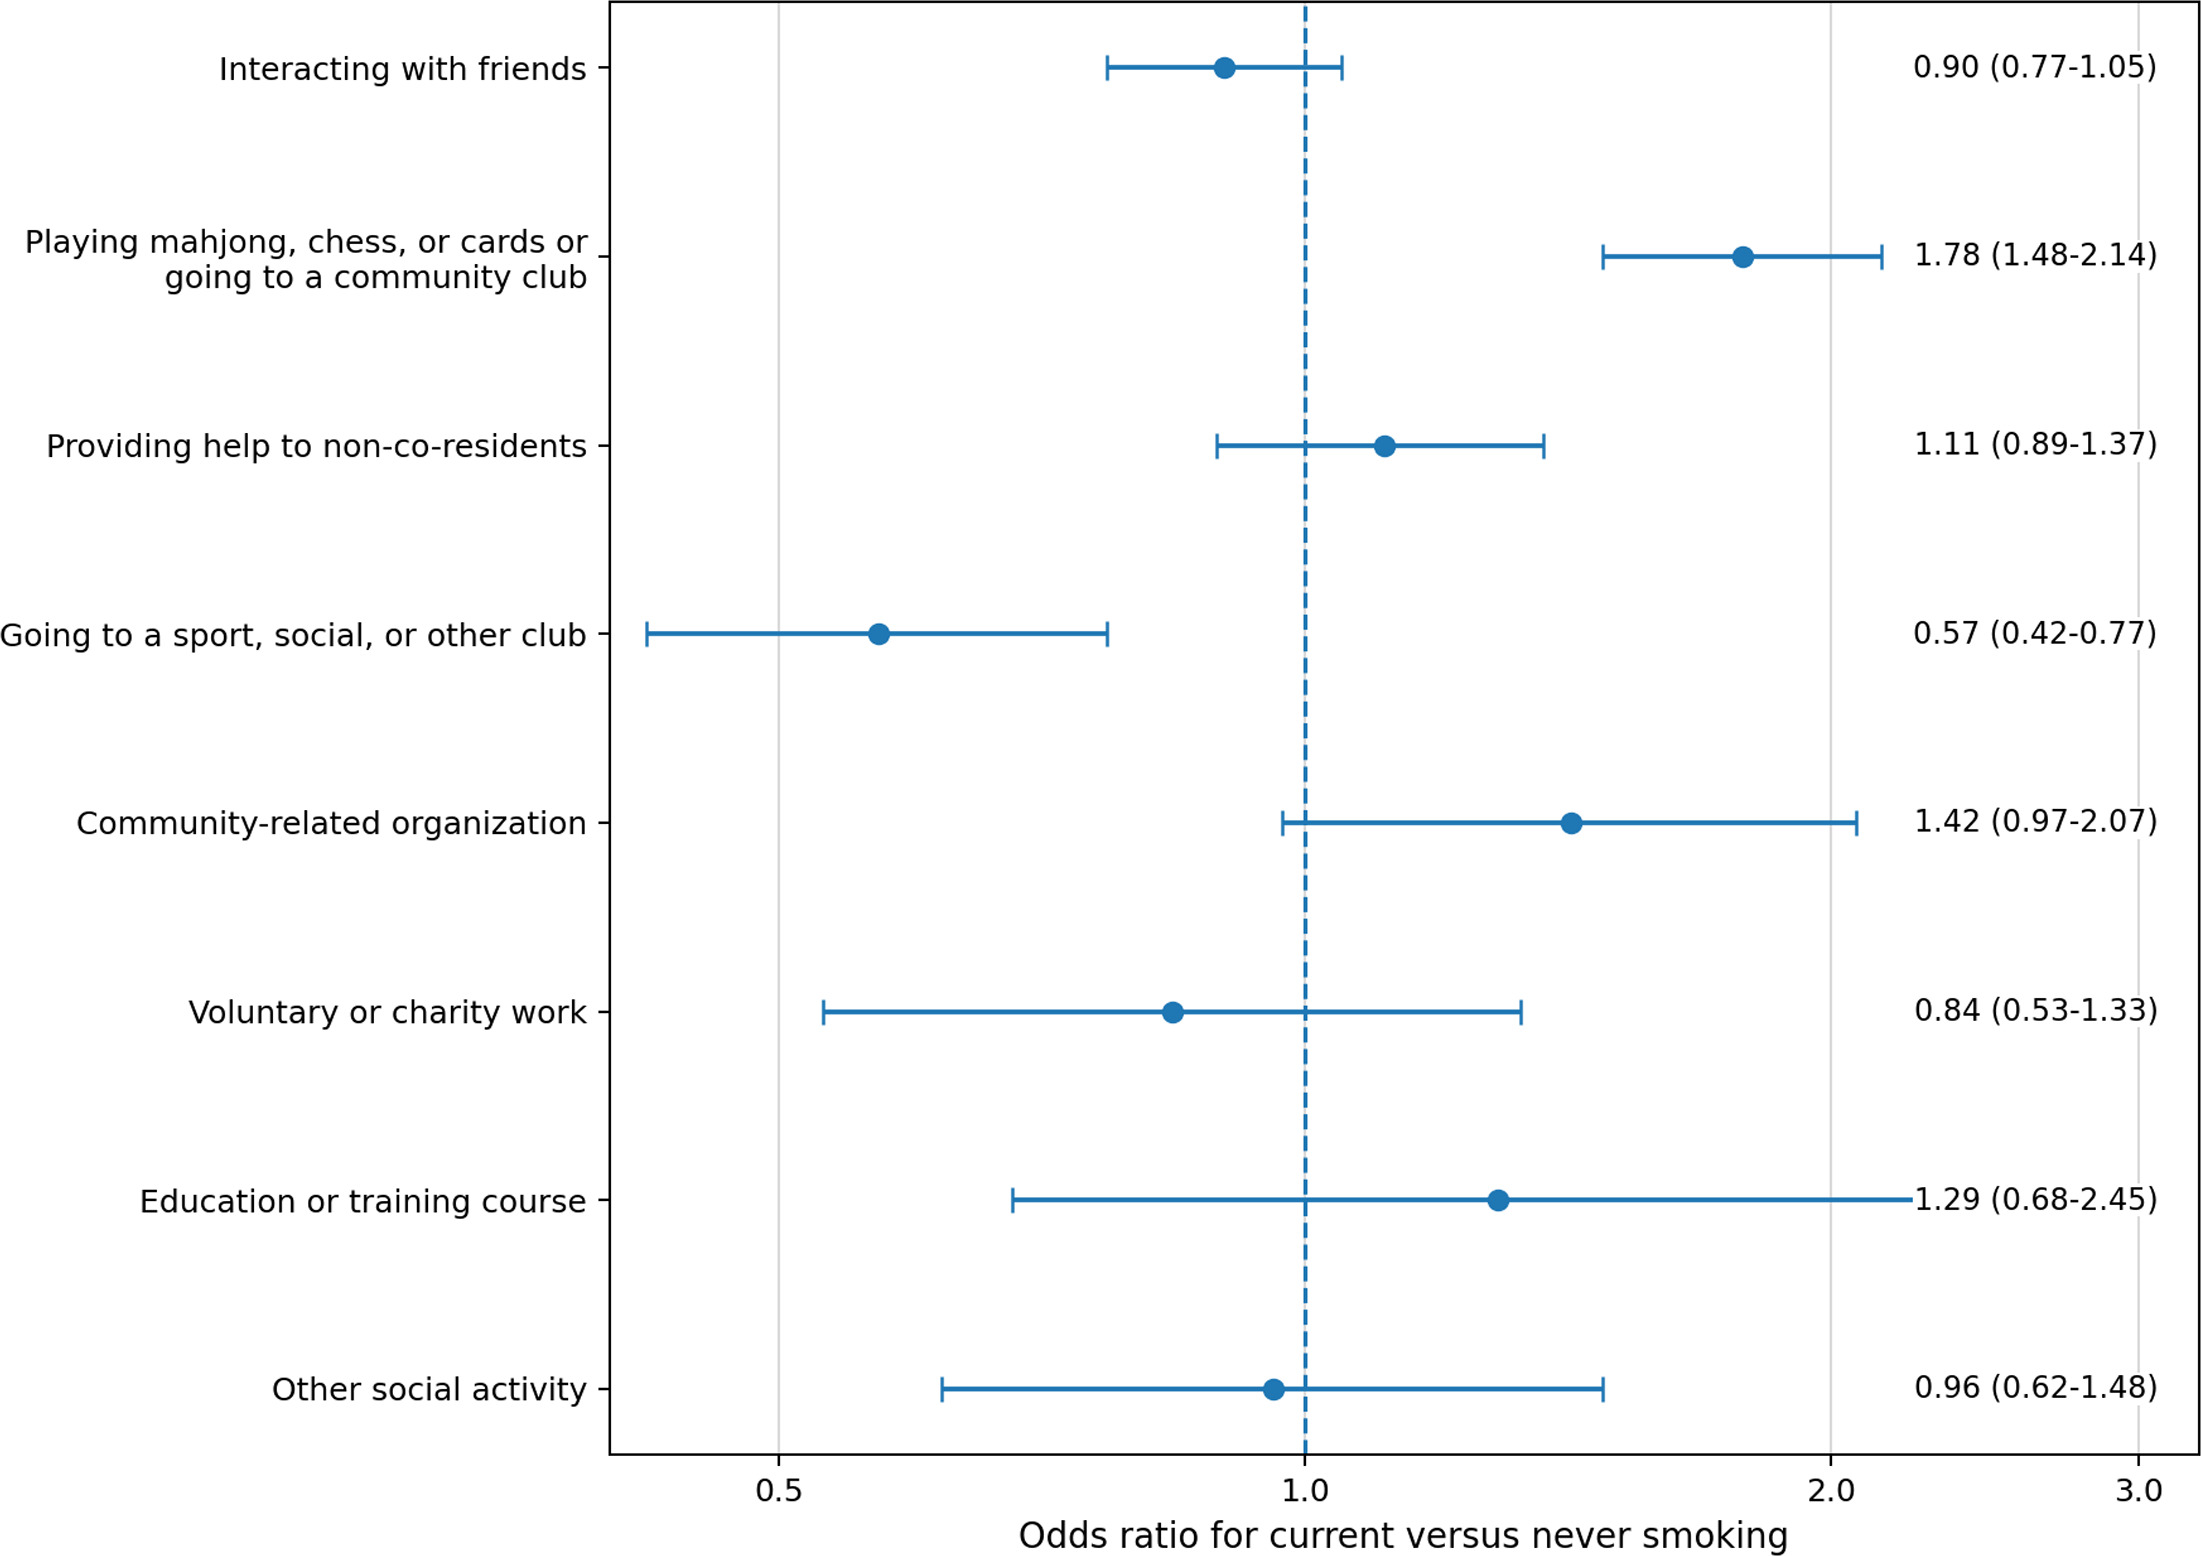
Adjusted odds ratios compare participants with non-participants for each activity. Error bars show 95% confidence intervals; the reference line is 1.00.
Table 3.
Fully adjusted associations of eight social activity items with current versus never smoking among Chinese adults aged ≥60 years, a cross-sectional secondary analysis of CHARLS 2020 (complete-case N=7804; 444 communities)
[i] AORs compare current with never smoking and participants with non-participants in each activity. All eight activities and prespecified covariates were entered simultaneously. Benjamini-Hochberg q-values were calculated across the eight activity coefficients. AOR: adjusted odds ratio. CI: confidence interval. FDR: false discovery rate.
Neither sex interaction met the two-sided 0.05 threshold (combined item: interaction p=0.065; ‘going to a sport, social, or other club’ item: interaction p=0.446). In sex-stratified models, the combined-item AOR was 1.65 (95% CI: 1.34–2.03; p<0.001) in men and 2.27 (95% CI: 1.64–3.15; p<0.001) in women. For the ‘going to a sport, social, or other club’ item, the AOR was 0.62 (95% CI: 0.42–0.91; p=0.014) in men and 0.50 (95% CI: 0.27–0.94; p=0.031) in women (Supplementary file Table S4).
Daily cigarette count and former-smoking status
The estimated dispersion parameter was alpha=0.44, and the likelihood-ratio test strongly favored negative binomial over Poisson regression [LR χ2(1)=9437.62; p<0.001] (Supplementary file Table S3B). Among 2376 current smokers, participation in the combined item was associated with a 14% higher expected daily cigarette count than non-participation (AIRR=1.14; 95% CI: 1.06–1.22; p<0.001; q=0.002) (Table 4). No other activity met the FDR threshold. Providing help to non-co-residents had a nominal inverse association (AIRR=0.91; 95% CI: 0.83 - –0.99; p=0.021) but did not meet the corrected threshold (q=0.084).
Table 4.
Fully adjusted associations of eight social activity items with daily cigarette count and former-smoking status among Chinese adults aged ≥60 years, a cross-sectional secondary analysis of CHARLS 2020 (current smokers N=2376; 427 communities; ever smokers N=3871; 440 communities)
[i] The cigarette-count model included 2376 current smokers from 427 communities; the former-versus-current model included 3871 ever smokers from 440 communities. The q-values were calculated separately across the eight activity coefficients within each outcome. The chronic-condition estimate was outside both FDR families. AIRR: adjusted incidence rate ratio. AOR: adjusted odds ratio. CI: confidence interval. FDR: false discovery rate.
Among 3871 ever smokers, none of the eight activities met the FDR threshold for former versus current smoking. The combined item had a nominal inverse association (AOR=0.80; 95% CI: 0.68–0.94; p=0.007; q=0.058). Each additional chronic condition was associated with higher adjusted odds of former versus current smoking (AOR=1.15; 95% CI: 1.11–1.19; p<0.001); this cross-sectional associated factor was not included in the eight-activity FDR family. Among 1742 former smokers, approximate time since cessation was calculable for 1643; the median was 8 years (IQR: 2–20), and 99 had missing or invalid cessation-timing information (Supplementary file Table S5).
Sensitivity analyses
Sensitivity estimates for the association between the combined item and daily cigarette count were: men only, AIRR=1.13 (95% CI: 1.05–1.22; p<0.001); excluding zero counts, AIRR=1.14 (95% CI: 1.07–1.22; p<0.001); excluding counts above 60 cigarettes/day, AIRR=1.14 (95% CI: 1.06–1.21; p<0.001); additional CES-D-10 adjustment, AIRR=1.15 (95% CI: 1.08–1.24; p<0.001); and community fixed-effects log-count model, exp(beta)=1.11 (95% CI: 1.03–1.20; p=0.010) (Table 5).
Table 5.
Sensitivity analyses of the adjusted association between the combined ‘Playing mahjong, chess, or cards or going to a community club’ item and daily cigarette count among current smokers aged ≥60 years, a cross-sectional secondary analysis of CHARLS 2020 (N=2376; 427 communities)
| Analysis | Model/Outcome | N |
Effect ratio
(95% CI) | p |
|---|---|---|---|---|
| Primary analysis | Negative binomial cigarettes/day model | 2376 | 1.14 (1.06–1.22) | <0.001 |
| Male-only current smokers | Negative binomial cigarettes/day model | 2136 | 1.13 (1.05–1.22) | <0.001 |
| Exclude zero cigarettes/day | Negative binomial cigarettes/day model | 2316 | 1.14 (1.07–1.22) | <0.001 |
| Exclude >60 cigarettes/day | Negative binomial cigarettes/day model | 2370 | 1.14 (1.06–1.21) | <0.001 |
| Additional CES-D-10 adjustment | Negative binomial cigarettes/day model | 2164 | 1.15 (1.08–1.24) | <0.001 |
| Community fixed-effects log-count modela | Community fixed-effects OLS of log cigarette count | 2376 | 1.11 (1.03–1.20) | 0.010 |
| Ordinal activity-frequency trendb | Negative binomial frequency-trend model | 2376 | 1.07 (1.03–1.10) | <0.001 |
The exposure was the complete CHARLS item. Non-participation was the reference. Estimates are AIRRs from negative binomial models except the fixed-effects analysis.
b For the ordinal trend, non-participation was coded 0, and activity frequency was coded 1 (not often), 2 (almost every week), and 3 (almost every day). The primary q-value was 0.002; sensitivity analyses were not included in FDR correction. AIRR: adjusted incidence rate ratio. CES-D-10: 10-item Center for Epidemiological Studies Depression Scale. CI: confidence interval. FDR: false discovery rate. OLS: ordinary least squares.
In the ordinal frequency model, each one-level increase in participation frequency was associated with a 7% higher expected daily cigarette count (AIRR=1.07; 95% CI: 1.03–1.10; p<0.001). The estimate excluding the 60 zero counts was similar to the primary estimate.
DISCUSSION
Associations were specific to both the activity item and smoking outcome. The combined ‘playing mahjong, chess, or cards or going to a community club’ item was associated with current versus never smoking and higher daily cigarette count. The ‘going to a sport, social, or other club’ item was associated with lower odds of current versus never smoking but not with cigarette count or former-smoking status. No activity met the FDR threshold for former versus current smoking, and the interaction tests did not provide statistical evidence that the two primary associations differed by sex. Chronic-condition count was associated with former-smoking status, but the temporal direction of this association is unknown.
Activity-specific associations
The association for the combined item is directionally consistent with research linking mahjong, chess, or card playing with persistent smoking and cigarette consumption among older Chinese adults13,14. The inverse association for the ‘going to a sport, social, or other club’ item was also directionally consistent with the earlier CHARLS finding for community-organized physical activities13, although the present composite item does not isolate sport or physical activity. The present analysis adds a simultaneous comparison of the complete Wave 5 activity inventory. Because CHARLS measures ‘playing mahjong, chess, or cards or going to a community club’ as one response option, the estimate cannot be attributed to mahjong or any other component alone.
One hypothesis is that participation in some group activities may involve greater exposure to smoking peers or tobacco cues. Cigarette sharing and gifting may reinforce the acceptability of smoking during social interaction10,11. The inverse association for the ‘going to a sport, social, or other club’ item could reflect participant selection, physical engagement, or differences among activity settings. CHARLS did not measure peer smoking, cigarette sharing, venue rules, or session duration, so these explanations were not tested and cannot establish whether participation influenced smoking or smoking influenced participation.
Outcome-specific associations
The cross-outcome comparison shows that an association with one smoking dimension did not necessarily extend to another. The combined item was associated with current-smoking status and daily cigarette count, whereas the inverse association for the ‘going to a sport, social, or other club’ item was limited to current-smoking status and should not be generalized to smoking intensity. The interaction tests did not support sex modification; the stratified estimates therefore should not be interpreted as evidence that the associations differed between men and women.
No activity met the FDR threshold for former-smoking status. Former versus current smoking depends on initiation, cessation timing, accumulated exposure, health events, and survival, which were only partially observed and cannot be fully reconstructed from one wave. The results therefore describe different associations across the examined outcomes rather than one general process across tobacco-use dimensions.
Chronic disease and former-smoking status
The chronic-condition association should be interpreted cautiously. A diagnosis may precede quitting, but the cross-sectional comparison cannot establish this sequence19,20. Accumulated illness, health-related quitting, and selective survival are alternative explanations. Former smokers who died before Wave 5 were not observed, and differential mortality by smoking history and disease burden could distort the association among survivors. The estimate is therefore hypothesis-generating and does not show that chronic disease caused cessation.
Implications for future research
These findings identify priorities for future research rather than targets for intervention. Studies should directly measure peer smoking, cigarette sharing, venue rules, session duration, and cessation support within each activity context. Because the ‘going to a sport, social, or other club’ item combines several settings, its inverse association cannot be assigned to sport, social clubs, or other clubs separately.
Longitudinal studies should test whether changes in activity participation precede changes in smoking and whether peer or venue characteristics explain the observed associations. Research on former smoking should characterize cessation timing and cumulative tobacco exposure more fully and account for intervening health events and mortality selection.
Strengths and limitations
Strengths of the study include the use of a large ageing survey, simultaneous modeling of eight non-mutually-exclusive activity indicators, comparison of three smoking outcomes, community-clustered inference, FDR control within prespecified outcome families, and several sensitivity analyses. Reporting the full activity matrix reduces emphasis on isolated nominal findings.
Several limitations remain. First, the cross-sectional use of Wave 5 cannot establish temporal ordering or causality; smoking may influence activity participation as well as the reverse8,9. Second, smoking, social activity, and health measures were self-reported and are subject to recall error, misclassification, and social-desirability bias. Third, several activity items combine heterogeneous behaviors, so their coefficients cannot be assigned to individual components. Fourth, cessation duration was described but was not incorporated into the regression models, cumulative tobacco exposure was unavailable, and selective mortality may affect former-versus-current comparisons. Fifth, complete-case analysis excluded 12.2% of eligible current/never smokers, 9.1% of current smokers, and 11.1% of ever smokers. The included primary-analysis sample was younger, more socially active, and less functionally impaired than excluded eligible participants, so selection related to complete data may have influenced the estimates. Sixth, the unweighted models do not provide nationally representative estimates. Seventh, social activity in 2020 may have been affected by the COVID-19 pandemic. Residual confounding and chance findings remain possible despite covariate adjustment and FDR control.
CONCLUSIONS
In this unweighted CHARLS 2020 sample of adults aged ≥60 years, associations between social participation and smoking differed by activity type and smoking outcome. Participation in the combined ‘playing mahjong, chess, or cards or going to a community club’ item was associated with higher odds of current versus never smoking and a higher daily cigarette count, whereas participation in the ‘going to a sport, social, or other club’ item was associated with lower odds of current versus never smoking only. No activity met the FDR threshold for former versus current smoking. These contrasting patterns show why social participation should not be analyzed or interpreted as a single, uniformly favorable exposure and why smoking status, intensity, and former-smoking status should be distinguished. The findings provide a focused basis for longitudinal research with survey-design adjustment and direct measurement of peer smoking and venue characteristics; they do not establish causal or intervention effects.