INTRODUCTION
Chronic obstructive pulmonary disease (COPD) is one of the leading causes of death worldwide. As of 2015, COPD affected about 174.5 million (2.4%) of the global population1. Approximately three million people died of COPD in 2015, accounting for 5% of all deaths worldwide in that year2. By 2030, COPD is expected to rank 4th on the list of causes of death and 7th in terms of disease burden7. In Korea, the prevalence of cigarette smoking and COPD among adults in 2016 was 23.9% and 12.1%, respectively. Due to its high prevalence, mortality and chronicity, COPD has been a global burden for many years. The Global Initiative for Chronic Obstructive Lung Disease (GOLD), led by the National Heart, Lung, and Blood Institute (NHLBI) and the World Health Organization (WHO), defines COPD as ‘a common, preventable and treatable disease that is characterised by persistent respiratory symptoms and airflow limitation that is due to airway and/or alveolar abnormalities usually caused by significant exposure to noxious particles or gases’3. Although environmental exposures such as air pollution, secondhand smoke and biomass smoke (e.g. animal dung and crop residues) and genetic factors may contribute to the development of COPD, smoking is predominantly the major cause4-6. The risk attributable to active smoking in COPD has been reported to be 40–70%7. Previously, it was considered that only 15–20% of smokers develop clinically significant COPD8; however, recent studies have reported that about 50% of smokers eventually develop COPD during their lifetime9,10. Given that only some smokers develop COPD, it is important to identify the factors that may influence the development of COPD among smokers. It has been reported that various factors, such as aging11,12, gender13,14, abnormal lung growth and development5, occupational exposure to particles15, air pollution16, infection17, lower socioeconomic status18-20, nutrition21, obesity22 and educational level23, were associated with a higher risk of developing cigarette smoke-induced COPD. Previous researchers have also reported that COPD risk varies according to ethnicity24,25. Therefore, some studies have examined the factors associated with COPD according to ethnicity or country; however, the risk factors identified were predominantly the same as those stated above17,18,26-29.
The objectives of the present study were to examine the following: 1) the prevalence of airflow limitation among smokers, suggestive of COPD; 2) the factors associated with airflow limitation among smokers, and 3) the relationship between smoking history and severity of airflow limitation. To address these, we analysed the data from the Korea National Health and Nutrition Examination Survey (KNHANES). The KNHANES is an ongoing, nationally representative, annual cross-sectional survey compiling health data of the civilian population in South Korea30.
METHODS
Data source and collection
The present study was a secondary data analysis of KNHANES data from 2010 to 2012 (the fifth survey) conducted by the Korea Centers for Disease Control and Prevention (KCDC). Since the inclusion and exclusion criteria for this study required chest x-ray data, as described below, only the fifth survey data that included chest x-ray information were used. The KNHANES consists of a health interview survey, a health examination survey and a nutritional survey. To minimise sampling bias, the KNHANES used a complex, stratified multistage probability cluster sampling design based on regional areas, sex and age. Further information about the study design and sampling process are provided elsewhere30. A total of 24173 individuals participated in the fifth (2010–2012) KNHANES survey. From among them, individuals who had undergone spirometry and smoked at least 100 cigarettes in their lifetime, regardless of current smoking status31,32, were included in the analysis. Records of individuals were excluded from the study if they: had never smoked or had smoked fewer than 100 cigarettes in their lifetime; had abnormal CXR findings due to lung diseases other than COPD as confirmed by a radiologist; had a history of other pulmonary diseases such as asthma, sarcoidosis, pulmonary tuberculosis, lung cancer or interstitial lung disease; and those who had a forced expiratory volume in 1 s (FEV1)/forced vital capacity (FVC) ratio ≥0.7 with < 80% of FVC to exclude the participants with restrictive lung disease33. Because spirometry was performed in individuals ≥40 years of age in the survey, individuals ≥40 years of age were included in this study. Therefore, a total of 2569 participants were included in this study. Figure 1 demonstrates the selection process and the number of study participants.

Measures
Spirometry
Spirometry was performed according to the acceptability and repeatability criteria published by the American Thoracic Society. The largest FVC and FEV1 were used for analysis after completing at least three acceptable adjustments34. The difference in FVC between the largest and next largest adjustments should be within 5% or 150 mL of each other, whichever is greater. If not, additional trials were made to meet the repeatability criteria34. The predicted value for each individual was determined using the reference equations derived from the Korean population35. Airflow limitation is defined by FEV1/FVC ratio <0.70, according to the GOLD guidelines33. Airflow limitation that is only partially reversible with a bronchodilator or is completely irreversible is the characteristic physiological feature of COPD33,36. Therefore, both pre- and post-bronchodilator spirometry data are needed to diagnose COPD. However, only pre-bronchodilator spirometry data were available for this study. The severity of airflow limitation is determined by the per cent predicted value of FEV1, thus the ranges FEV1≥80%, 50%≤FEV1<80%, 30%≤FEV1<50% and 30%<FEV1 are observed in patients with mild, moderate, severe, and very severe airflow limitation, respectively33,34.
Clinical diseases
Diabetes mellitus (DM) was defined as a fasting blood glucose level ≥126 mg/dL, taking oral hypoglycaemic agents or insulin injection or having been diagnosed with DM. Hypertension was defined as a systolic blood pressure ≥140 mmHg, a diastolic blood pressure ≥90 mmHg or taking antihypertensive medications. Other diseases were defined based on a participant’s medical history30.
Health behaviours, perceived health status and mental health
The definition of smokers in our study was based on the guidelines of the Centers for Disease Control and Prevention (CDC): non-smokers were those who smoked <100 cigarettes in their lifetime, current smokers were those who smoked ≥100 cigarettes in their lifetime and were current smokers at the time of the survey, and ex-smokers were those who smoked >100 cigarettes in their lifetime but quit smoking at the time of the survey31,32. Lifetime smoking amount (pack-years) was calculated by multiplying the number of packs of cigarettes smoked per day by the number of years the person smoked. Alcohol drinking was defined as the consumption of more than seven glasses of alcoholic drink per occasion, more than two times per week. Regular exercise was defined as a moderate level of physical exercise for ≥30 min at a time ≥5 times per week30. Perceived health status was categorised into different groups — very good/good, fair or poor/very poor by self-rated levels of health status. Health-related quality of life (HRQoL) was evaluated using the EuroQoL37. The EuroQoL measures both a health-status descriptive system (EQ-5D) and a visual analogue scale (EQVAS), and ranges from 0 to 100, where zero signifies worst health condition and 100 designates best health condition37. Stress was defined as stress perceived to be moderate to severe. Depressive symptoms were defined as feelings of sadness disruptive to one’s activities of daily living for at least two consecutive weeks in the past year. Suicidal ideation was defined as intention of committing suicide during the past year30.
Statistical analysis
All data were analysed using SAS version 9.3 (SAS Institute Inc., NC, USA); p<0.05 was considered to be statistically significant. The data are presented as mean ± standard error (SE) for continuous variables or proportions for categorical variables. T-tests, ANOVA and χ2 tests were performed to evaluate the differences among the groups for continuous and categorical variables, respectively. Multiple logistic regression analyses were performed to explore the associations between airflow limitation and various factors. Variables that were statistically significant in the univariate tests were selected for the multivariate analyses. The results were reported using adjusted odd ratios (ORs) and their 95% confidential interval (CI). A 95% CI that did not span 1.0 was considered to be statistically significant.
RESULTS
Prevalence of airflow limitation and mean ages of the study participants
Table 1 summarise the prevalence of airflow limitation and mean ages of the study participants according to their smoking status. The prevalence of airflow limitation among the study participants was 19.2% and 22.1% in current and former smokers, respectively. The mean ages of the study participants were 51.40 and 55.97 years among current and former smokers, respectively. The mean age of study participants with airflow limitation was 60.98±0.78 and 64.83±0.82 years among current and former smokers, respectively. Regardless of smoking history, participants with airflow limitation were older than those with normal spirometry results. In addition, Supplementary Tables 1.1 and 1.2 summarise the prevalence of airflow limitation and mean ages of the entire population for whom spirometry was performed, including non-smokers.
Table 1
Prevalence of airflow limitation and mean age (years) among the study participants (current and former smokers)
Sociodemographic characteristics and smoking history
Table 2 summarises the sociodemographic characteristics of the study participants according to the presence or absence of airflow limitation. The mean age of the group with airflow limitation was significantly higher (62.98 years) than that of the group without airflow limitation (51.17 years; p<0.001). Furthermore, the prevalence of airflow limitation increased in older populations. The prevalence of airflow limitation in participants between 40 and 55 years of age was the lowest (9.1%), and the prevalence of airflow limitation in participants ≥76 years of age was highest (65.9%; p<0.001). In addition, the prevalence of airflow limitation was significantly higher in male (p=0.024), divorced, separated or widowed (p<0.001) and unemployed (p<0.001) participants who resided in rural areas (p=0.005). Household income showed no difference between groups.
Table 2
Sociodemographic characteristics of study participants according to the presence or absence of airflow limitation (N = 2569)
Table 3 summarises smoking history of study participants according to the presence or absence of airflow limitation. The daily smoking amount also did not show a significant difference between two groups; however, there was a significant difference between groups in regard to years of smoking, leading to a significantly higher pack-years in the group with airflow limitation compared with the group without airflow limitation (p<0.001).
Table 3
Smoking history of study participants according to the presence or absence of airflow limitation (N=2569)
Health behaviours, mental health, nutritional status and medical comorbidities
Table 4 summarises comorbidities, health behaviours and mental health status of study participants according to the presence or absence of airflow limitation. All of the nutritional indices measured were significantly worse in the group with airflow limitation. The group with airflow limitation had more participants with comorbidities including DM, hypertension, CVD and cancers compared with the group without airflow limitation. Based on the EuroQoL surveys, HRQoL was significantly worse in the group with airflow limitation.
Table 4
Comparison of health behaviors, mental health, and medical conditions between group with or without airflow limitation
| Variables | Group with airflow limitation | Group without airflow limitation | p | ||
|---|---|---|---|---|---|
| n | Mean±SE or weighted % ±SE | n | Mean±SE or weighted % ±SE | ||
| SBP (mmHg) | 583 | 126.35±0.89 | 1984 | 120.85±0.46 | <0.001 |
| DBP (mmHg) | 583 | 77.31±0.58 | 1984 | 79.76±0.34 | <0.001 |
| BMI (kg/m2) | 583 | 23.72±0.16 | 1086 | 24.42±0.07 | <0.001 |
| 25(OH)D (ng/mL) | 559 | 19.51±0.36 | 1944 | 19.24±0.22 | 0.467 |
| Dietary Intake | |||||
| (Kcal/day) | 529 | 2136.66±50.86 | 1686 | 2428.38±29.26 | <0.001 |
| Protein (g/day) | 529 | 73.90±2.54 | 1686 | 86.09±1.25 | <0.001 |
| Fat (g/day) | 529 | 34.23±1.47 | 1686 | 47.15±0.99 | <0.001 |
| Carbohydrate (g/day) | 529 | 347.94±8.24 | 1686 | 369. 60±4.59 | 0.019 |
| Vitamin A (ugRE) | 529 | 854.73±60.73 | 1686 | 1008.99±39.85 | 0.031 |
| Vitamin B1 (mg) | 529 | 1.31±0.04 | 1686 | 1.61±0.03 | <0.001 |
| Vitamin B2 (mg) | 529 | 1.19±0.04 | 1686 | 1.44±0.02 | <0.001 |
| Vitamin C (mg) | 529 | 98.56±4.01 | 1686 | 122.58±2.63 | <0.001 |
| Total cholesterol (mg/dL) | 559 | 187.25±2.21 | 1944 | 194.57±1.04 | 0.002 |
| Diabetes mellitus (%) | 544 | 18.57 | 1895 | 12.34 | <0.001 |
| Hypertension (%) | 582 | 49.31 | 1978 | 35.69 | <0.001 |
| CVD (%) | 583 | 6.00 | 1986 | 4.08 | <0.001 |
| *Cancer (%) | 583 | 4.97 | 1984 | 2.87 | 0.003 |
| Heavy drinker (%) | 437 | 18.99 | 1702 | 28.43 | 0.006 |
| Regular exerciser (%) | 583 | 9.26 | 1985 | 10.48 | 0.997 |
| Perceived health status (%) | 582 | 1984 | <0.001 | ||
| Very good/good | 34.53 | 36.39 | |||
| Fair | 44.50 | 49.70 | |||
| Poor/very poor | 20.96 | 13.91 | |||
| EQ-5D | 582 | 0.92±0.01 | 1984 | 0.96±0.00 | <0.001 |
| EuroQoL:VAS | 582 | 71.28±1.08 | 1982 | 75.32±0.45 | <0.001 |
| Perceived psychological stress (% for yes) | 583 | 15.09 | 1986 | 24.62 | <0.001 |
| Depressive symptom (%) | 583 | 9.78 | 1986 | 10.67 | 0.681 |
| Suicide ideation (%) | 583 | 21.0 | 1986 | 79.0 | 0.316 |
Lifetime smoking amount and severity of airflow limitation
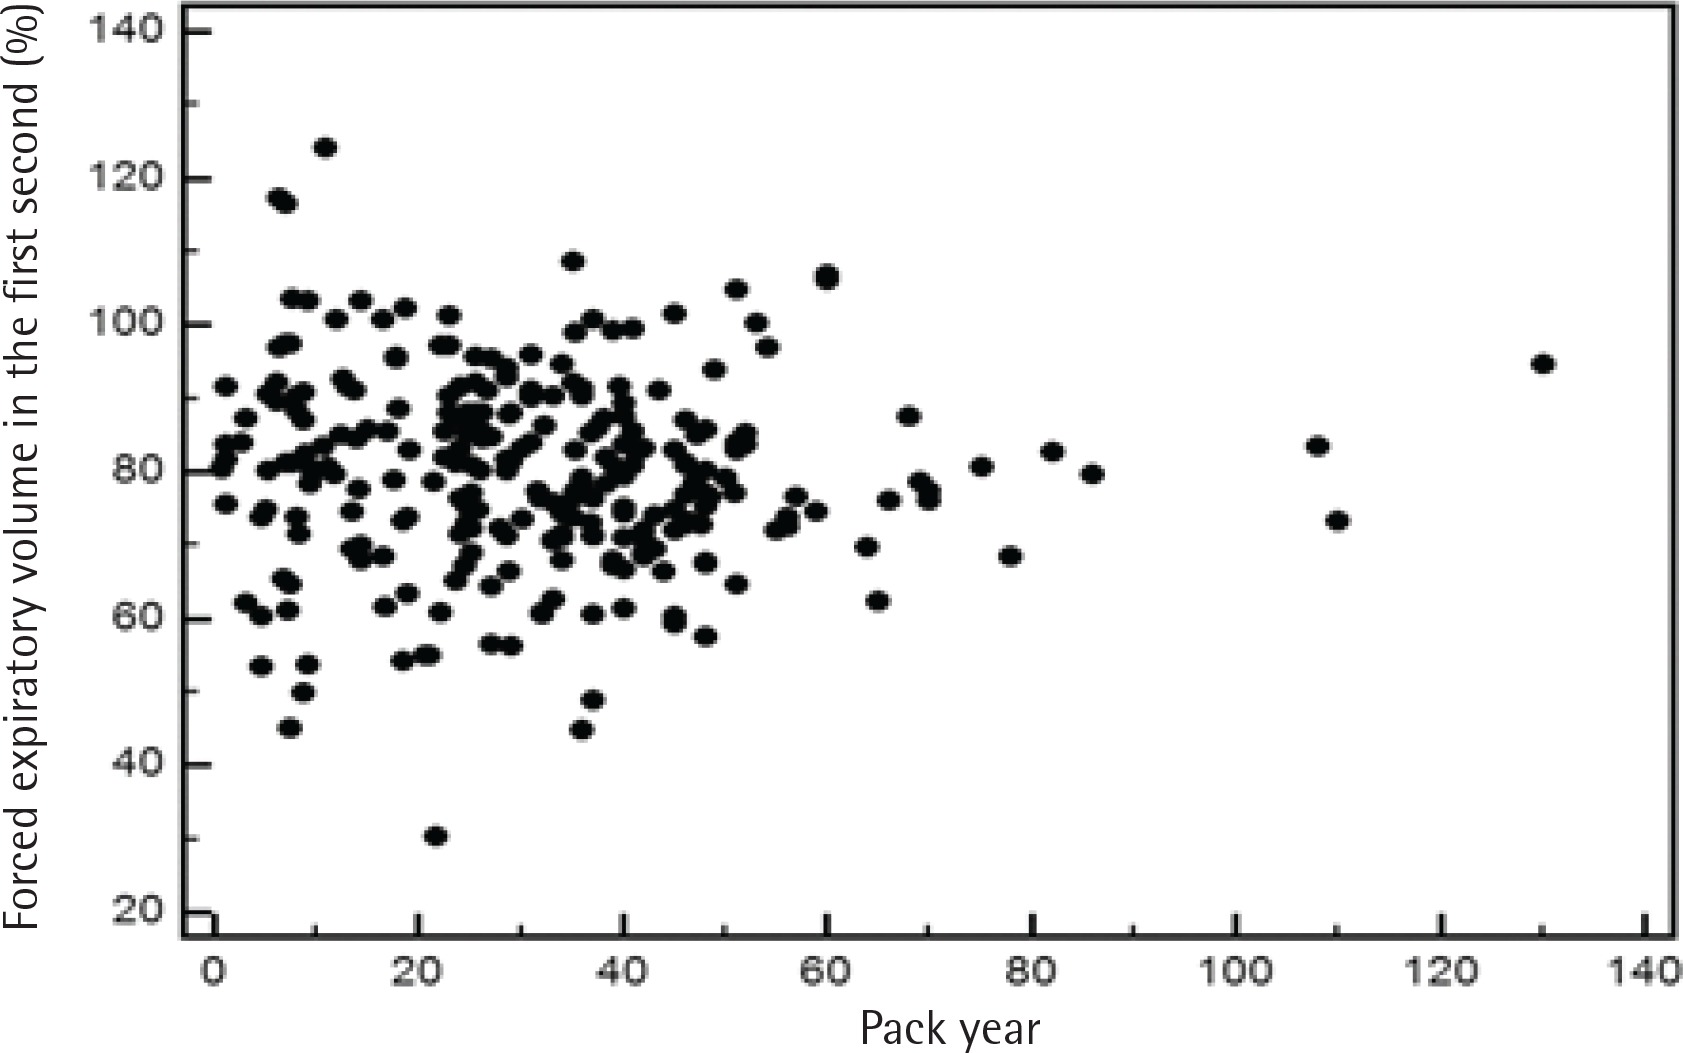
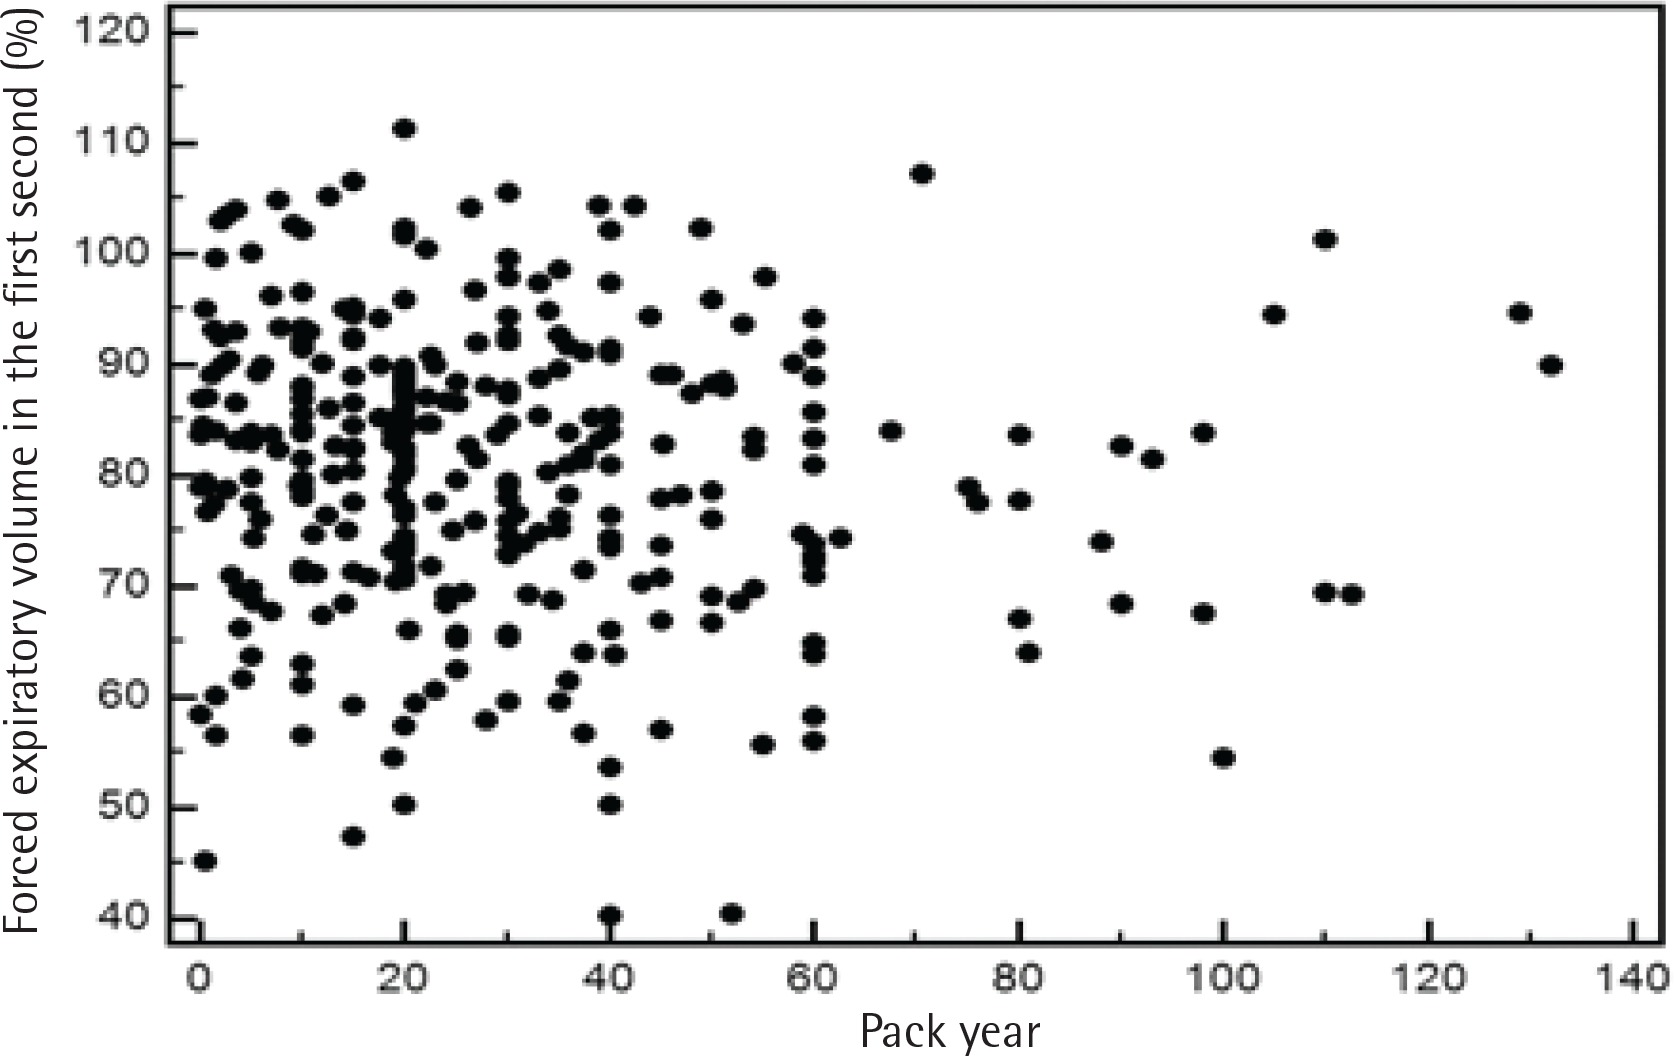
To address the relationship between severity of airflow limitation and total lifetime smoking amount, a Pearson’s correlation analysis was performed between per cent predicted values of FEV1 and total lifetime smoking amount with no significant correlation between the two, among both current and former smokers (Figures 2 and 3).
Factors associated with the development of airflow limitation among smokers
Table 5 and Supplementary Table 2 summarise the factors associated with the development of airflow limitation. Age, male gender and lifetime smoking amount were significantly associated with the development of airflow limitation after controlling for sociodemographic, nutritional and various health-related conditions. Smokers aged 56–65 years, 66–75 years and ≥76 years were 2.32, 4.33 and 9.74 times, respectively, more likely to have airflow limitation than smokers between 40 and 55 years of age (95% CI: 1.54–3.50; 2.47–7.60; and 3.61–26.27, respectively). Male smokers were 3.03 (95% CI: 1.38–6.68) times more likely to have airflow limitation than female smokers. In terms of lifetime smoking history, an increase of one pack-year corresponded to a 1.02 (95% CI: 1.01–1.03) times higher chance of developing airflow limitation.
Table 5
Factors associated with the development of airflow limitation among study participants
| Factors | Adjusted OR ( 95% CI)a | p |
|---|---|---|
| Age (ref: 40–55 years) | ||
| 56–65 | 2.32 (1.54–3.50) | <0.001 |
| 66–75 | 4.33 (2.47–7.60) | <0.001 |
| ≥76 | 9.74 (3.61–26.27) | <0.001 |
| Gender (ref: Female) | ||
| Male | 3.30 (1.38–6.68) | 0.006 |
| Lifetime smoking amount | ||
| (pack-years) | 1.02 (1.01–1.03) | <0.001 |
DISCUSSION
The present study investigated the prevalence of airflow limitation, suggestive of having COPD, among smokers, factors associated with airflow limitation among smokers and the relationship between smoking history and the severity of airflow limitation among Korean smokers using the nationally representative cross-sectional survey data publicly available through KNHANES (http://knhanes.cdc.go.kr). Most studies exploring risk factors for COPD have compared smokers and non-smokers, with smoking as only one of the independent variables26,29. In this study, we took a different approach, studying only smokers and comparing those with or without airflow limitation. We believe that such a simplified approach would give us a clearer answer regarding why only some smokers develop COPD. Airflow limitation that is only partially reversible with a bronchodilator or is completely irreversible is the characteristic physiological feature of COPD33,36. Given the lack of the data of post-bronchodilator FEV1 in this study, we adopted the term ‘airflow limitation’ instead of COPD in the present study. The principal findings of this study will be summarised next.
First, the prevalence of airflow limitation among smokers in the present study was approximately 20% (Table 1), which is comparable with rates previously published in cross-sectional studies similar to ours8. As mentioned earlier, previous researchers have reported that COPD risk varies according to ethnicity24,25. For instance, COPD has a higher prevalence in White than in non-White ethnicities24,25. Possible reasons proposed for such ethnic differences include variable pathways for nicotine metabolism or differences in dietary intake of fruit and vegetables, among others38,39. Nonetheless, the prevalence of airflow limitation among smokers in the present study was comparable with rates previously observed40.
Second, among the many variables we examined, only age, male gender and lifetime smoking amount were significantly associated with the development of airflow limitation (Table 5 and Supplementary Table 2). This indicates that an older Korean man who is a heavy smoker is more likely to develop COPD. The importance of aging in the pathogenesis of COPD has been suggested by others12. For example, the incidence of COPD increases with age, with the greatest increase observed in patients aged 65–74 years11. Normal aging results in the loss of elastic recoil, stiffening of the chest wall, gas exchange alteration, and decrease in exercise tolerance. These changes are similar to those in patients with emphysema. Thus, aging is considered to be a significant contributor to the development of COPD12. Next, a significant association between lifetime smoking amount and airflow limitation was observed, and the prevalence of airflow limitation was significantly higher in male smokers in this study. Although COPD is believed to be more common in men, some researchers suggest that women are actually more susceptible to tobacco-induced lung diseases13,14. Because of increased tobacco use among women in high-income countries and the higher risk for exposure to indoor air pollution (such as solid fuel used for cooking and heating) in low-income countries, the disease now appears to affect men and women almost equally41.
Third, we examined the relationship between pack-years and the severity of airflow limitation. Although we observed a significant association between pack-years and the prevalence of airflow limitation, oddly, the severity of airflow limitation did not have a significant correlation with pack-years in our study (Figures 2 and 3). According to a recent study, the single best variable for predicting COPD development is a >40 pack-year history of smoking42. However, a threshold for daily smoking amount and years of smoking resulting in COPD may vary from one individual to another9. Of note, a positive relationship between pack-years and the prevalence of airflow limitation in this study appears not to be due to daily smoking amount but due to years of smoking, as suggested in Table 3. Intriguingly, a recent study has reported that ‘years of smoking’ alone provides risk estimates of COPD43. Most studies use pack-years to assess the lifetime smoking amount, but the pack-years value is a measure that assigns the same weight on both daily smoking amount and years of smoking. The Lung Health Study, which included participants from diverse ethnic backgrounds, reported that increasing daily smoking amount is associated with rapidly declining lung function in mild-to-moderate COPD; however, no direct comparisons were made between daily smoking amount and years of smoking44. Another cross-sectional study using the COPDGene cohort of current and former smokers with non-Hispanic White or African-American ethnic background showed that ‘years of smoking’ was a more important factor in the development of COPD43. Therefore, it would be interesting to identify which factor—daily smoking amount, years of smoking or lifetime smoking amount (pack-years)—is most responsible in the development of COPD according to ethnicity in future studies.
Other findings of our study are also worth mentioning. Although they did not turn out to be significant factors after controlling for multiple variables, most nutritional indices, comorbidities and quality of life were significantly worse in the airflow limitation group when a simple comparison was made (Table 4). Nutritional deficiency in COPD may result from an imbalance between energy intake and consumption. Inadequate intake has been explained by impaired regulation of leptin, a hormone that reduces food intake, in the setting of chronic dyspnoea. The increased energy consumption may be due to the increased work expanded in breathing or increased protein catabolism due to systemic inflammation45. Paradoxically, the prevalence of metabolic syndrome is also high in COPD22. A recent meta-analysis has shown that healthy diet characterised by high intake of vegetables, fruit, fish and whole-grain products was associated with a decreased risk of COPD, while an unhealthy diet characterised by all kinds of red and processed meats, refined grains, sweets and French fries was associated with an increased risk of COPD21. Therefore, it seems that both nutritional deficiency and excess intake, as well as dietary patterns, which could be related to geographical differences, seem to be associated with the development of COPD. It is not clear whether ethnicity plays a different role in the development of COPD according to the nutritional status. Nonetheless, we did not find nutrition a significant factor in the development of airflow limitation among Korean smokers (Tables 4 and 5). COPD is often accompanied by comorbidities, such as cardiovascular disease, metabolic syndrome, DM and gastro-oesophageal reflux46. These comorbidities are associated with frequent exacerbation of COPD and increased mortality associated with COPD47-50. Although the prevalences of DM, hypertension, CVD and cancers were higher in the group with airflow limitation, we did not find comorbidity as a significant factor in the development of airflow limitation among our study participants (Tables 4 and 5). Also, the level of household income showed no difference between the group without airflow limitation and the group with airflow limitation, suggesting that socioeconomic status might not be a critical factor in the development of airflow limitation among Korean smokers, contrary to what has been previously reported19.
In the past, previous researchers have reported that various factors, such as aging11,12, gender13,14, abnormal lung growth and development5, occupational exposure to particles15, air pollution16, lower socioeconomic status19,20, nutrition21, obesity22 and educational level23, were associated with the development of COPD among smokers. In addition, a few studies have examined the factors associated with COPD according to ethnicity or country, and the identified risks were more or less the same as reported herein17,18,26-29. However, the effect of air pollution, biomass smoke or chronic respiratory infection such as tuberculosis, often revealed different factors depending on the geographical location17,18,26-29. Notably, one study investigated the factors of airflow limitation using the same cohort of KNHANES. Unlike our study, it analysed the prevalence of airflow limitation and the factors associated with airflow limitation in the entire population, including non-smokers. The prevalence of airflow limitation in that study was understandably lower than that reported by us owing to the inclusion of non-smokers in the analysis. The study reported that age, smoking amounts, male gender and having asthma or tuberculosis were associated with higher prevalence of airflow limitation. Further, obesity and higher educational levels were associated with lower prevalence of airflow limitation23. Considering that we applied stricter inclusion and exclusion criteria to select the study participants and our data were derived from only smokers, it will be difficult to make a direct comparison between the two studies. However, the other study also reported age, smoking amount and male gender as critical factors associated with the development of COPD among Korean smokers.
Limitations
Our study has some limitations. To diagnose COPD definitively, post-bronchodilator spirometry data are needed to exclude patients with reversible airflow limitation, such as those with asthma. Unfortunately, the KNHANES data do not include post-bronchodilator spirometry results. However, we believe that most patients with airflow limitation in our study had COPD for the following reasons: we excluded patients with a history of asthma; all those included were smokers; and those with other pulmonary diseases apparent on CXR were excluded. Therefore, we believe that our findings are reliable even without post-bronchodilator spirometry data. However, we recognise that some patients with asthma or asthma COPD overlap (ACO) might have been included. In addition, we could not analyse the effect of medication that the participants were taking as some, such as beta blockers, could influence airflow limitation; furthermore, we could not take into account the effect of exposure to air pollution, occupational hazards and the inhalation of biomass fuel or particles, which are all established factors associated with COPD, due to a lack of detailed information15,16.
CONCLUSIONS
We conducted the present study to identify the factors that make a ‘susceptible smoker’ develop airflow limitation, suggestive of having COPD, among smokers in Korea. We did this using a nationally representative cross-sectional survey by comparing smokers with and without airflow limitation. After controlling for multiple variables, we found that age, male sex and pack-years were the only factors significantly associated with the development of airflow limitation. This study also suggests that among Korean smokers, years of smoking may be a more important factor associated with airflow limitation than daily smoking amount. Our study findings indicate that the best way to prevent the development and progress of COPD is smoking cessation.