
ABBREVIATIONS TPS: total passive smoking, SR: self-report, UC: urine cotinine, LOD: limit of detection, HPS: home passive smoking, WPS: workplaces passive smoking, PPS: public places passive smoking, PPV: positive predictive value, NPV: negative predictive value
INTRODUCTION
Burden of passive smoking
Passive smoking (PS) also affects health by almost a similar mechanism as direct smoking1,2. Moreover, substances from side-stream smoke, a significant cause of PS, emit higher levels of carcinogens and toxins than mainstream smoke3. PS is a leading cause of death and it harms almost all parts of the human body, including the bladder, blood, colon, liver, stomach, and respiratory system. In addition, it causes serious diseases such as cancer and cardiovascular disease, leading to premature death4. It is estimated that 1.2 million people die yearly from PS2. Previous studies have shown sufficient evidence that PS is a cause of lung cancer. Moreover, it has been reported to positively affect the breast, cervical, larynx and pharynx, and nasal cancer5. For these reasons, the International Agency for Research on Cancer designated PS as a Group 1 carcinogen in 20045. In addition, PS is harmful to mental health, and it is a risk factor for dementia6, and is known to have a negative effect on depressive symptoms7 and mental health among adolescents8.
The burden of PS on the economy and healthcare is also considerable9. The social cost of tobacco is estimated to be on average 1.2% in low-income countries and 2.2% in high-income countries, and can be more than 3% of the maximum gross domestic product (GDP)10. Although studies on the economic burden caused by PS are limited, a study in Hong Kong estimated it to be as high as US$9.4 billion (5.6% of GDP)11.
Global efforts have been made to prevent PS, and regulations in smoke-free areas have been strengthened worldwide. Smoke-free legislation effectively prevents heart disease12 and reduces healthcare costs13. For these reasons, the World Health Organization is recommending measures globally to prevent PS within the context of Article 8 of the Framework Convention Tobacco Control, the first international convention in the health field; hence, exposure to PS and active smoking is declining14,15.
Assessment of passive smoking
The most common method used to measure PS is self-report, due to practical reasons such as cost and convenience16. Previous studies reported that self-report underestimates the exposure rate compared to biomarkers17,18. Cotinine is a nicotine metabolite, a biomarker that best reflects smoking exposure. Accordingly, some high-income countries are using cotinine to conduct surveillance for PS. Healthy people in the US and the NHS in the UK aim to reduce exposure to PS by reducing body cotinine levels regarding PS for non-smokers19,20. However, in most investigations, PS exposure is still measured by self-report (SR). Studies on how well SR reflects PS compared to biomarkers are still inadequate. In particular, studies using these two methods to compare and evaluate their accuracy are scarce.
Aims and objectives
Therefore, this study aimed to confirm whether SR could accurately reflect PS exposure compared to biomarkers, a golden standard for the assessment of exposure of non-smokers. To achieve this, we firstly compared the rates of PS using biomarkers and SR, and secondly, we calculated the sensitivity, specificity, positive predictive value (PPV), and negative predictive value (NPV), based on biomarkers.
METHODS
Data and selection of participants
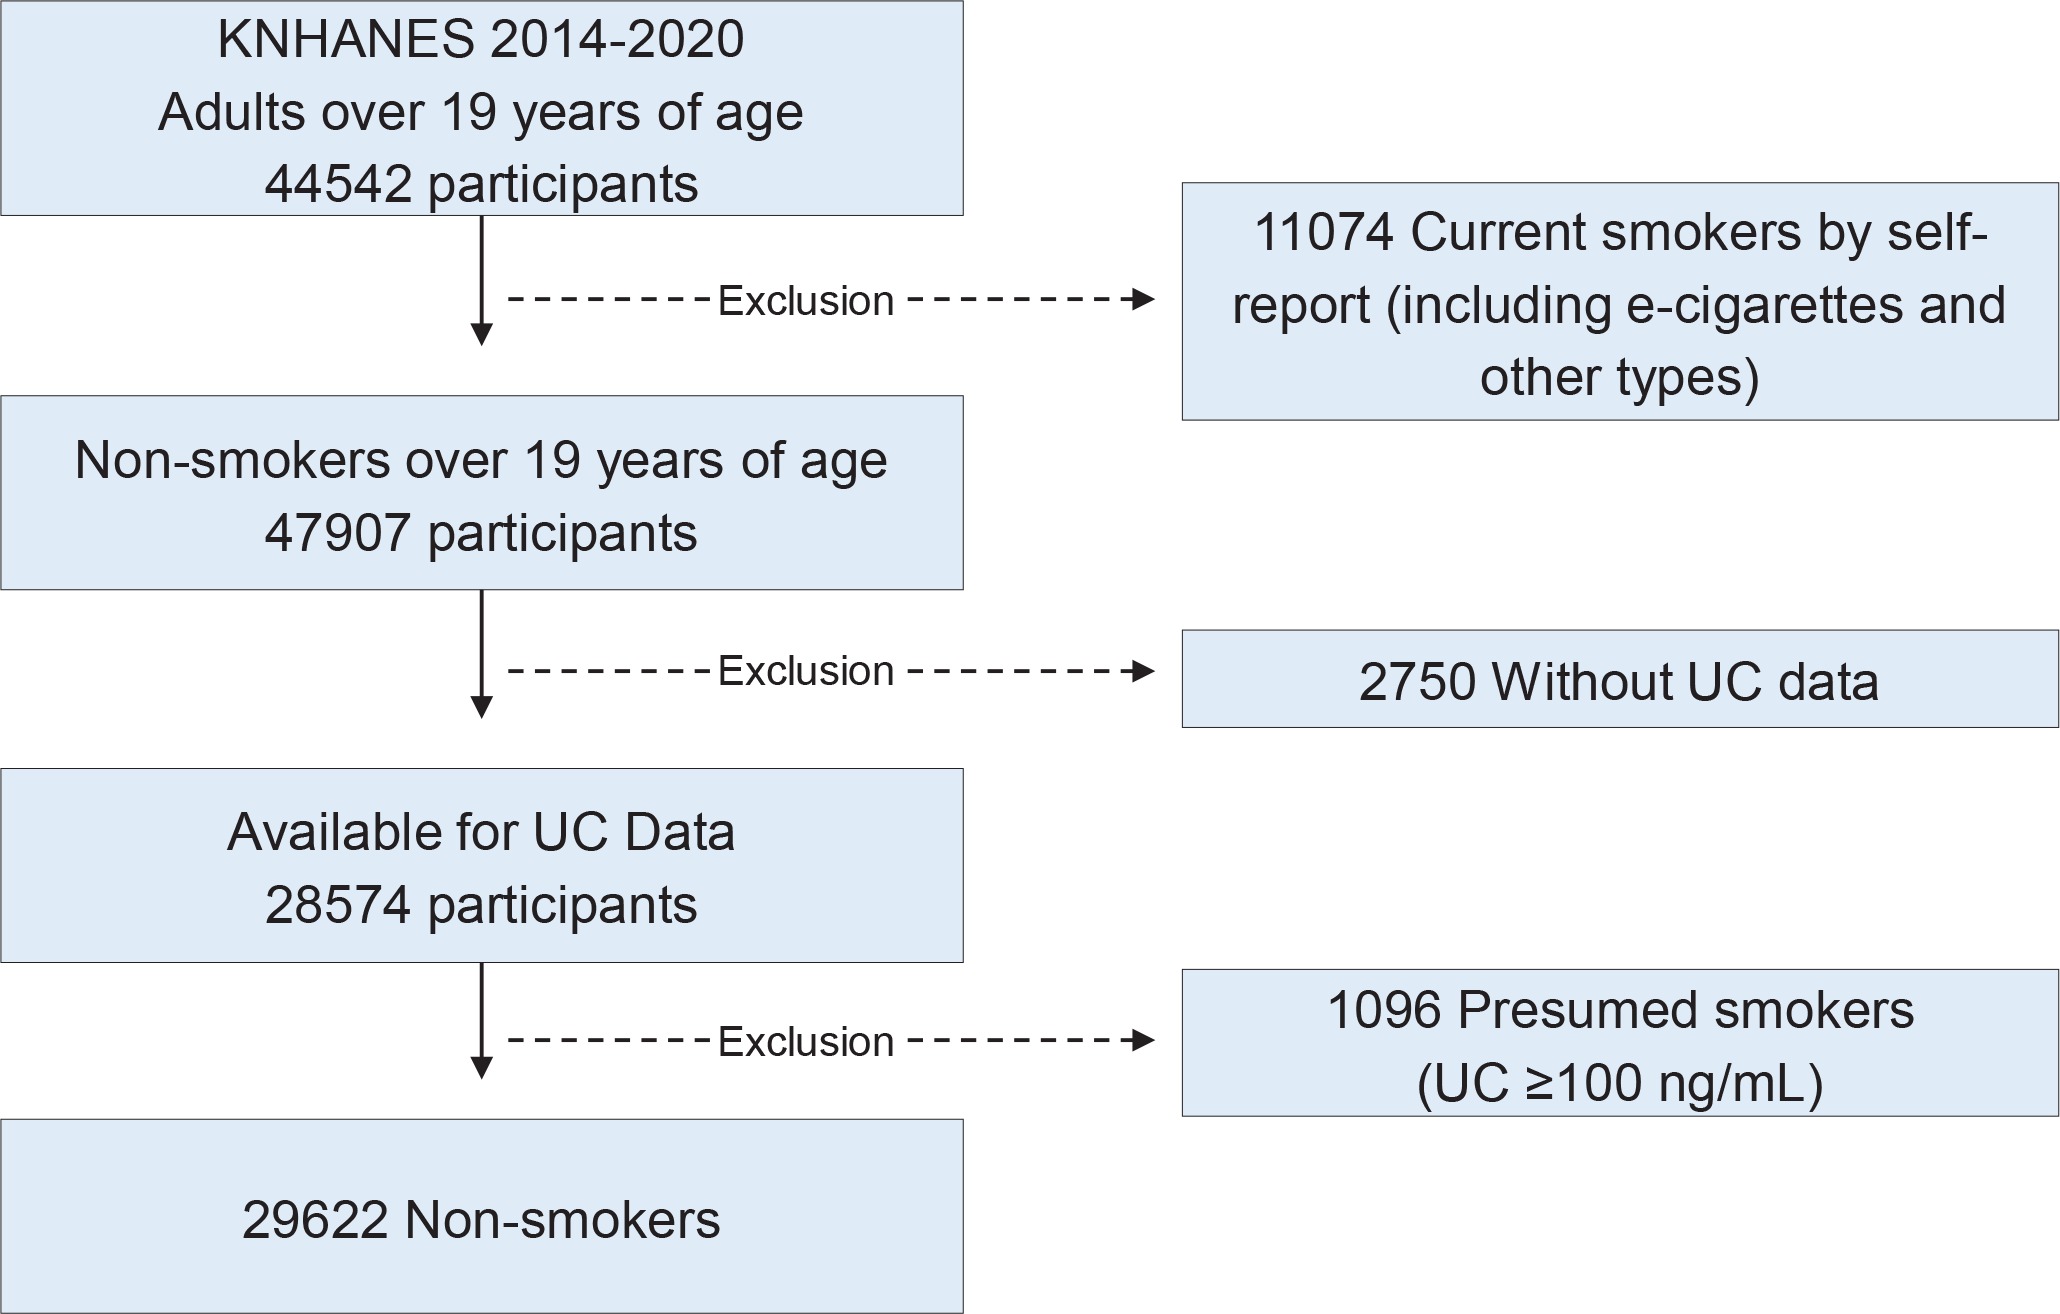
The Korea National Health and Nutrition Examination Survey (KNHANES) is conducted by the Korea Disease Control and Prevention Agency (KDCA). This study evaluated the accuracy of PS measurement in non-smokers using both urine cotinine (UC) as biomarker and SR. In KNHANES, UC is measured for individuals aged >6 years, but questions regarding PS are only asked from adults aged ≥19 years. Therefore, we included study participants who were aged ≥19 years from 2014–2020. Among 44542 adults, 11074 people were excluded because by self-report they said that they were currently smoking but also used e-cigarettes and other types of tobacco, and another 2750 people were excluded because their UC was not measured. Finally, 29622 people were recruited, after excluding 1096 current smokers who had a UC ≥100 ng/mL as their probability of false report due to social desirability was high21 (Figure 1).
Measurement of urine cotinine
UC concentration was measured by gas chromatography–tandem mass spectrometry with a Perkin Elmer Clarus 600T instrument (Perkin Elmer, Turku, Finland) in 2014–2017 and by high-performance liquid chromatography–tandem mass spectrometry system on an API 4000 system using the TurboIonSpray interface and multiple reaction monitoring (Applied Biosystems/MDS Sciex, Redwood City, CA, USA) from 2018.
Definition of variables
Those classified as PS in the workplace (WPS) were those who answered ‘yes’ to the question: ‘During the past seven days, have you ever inhaled other people’s cigarette smoke indoors at work?’. Those classified as home PS (HPS) were those who answered ‘yes’ to the question: ‘In the past seven days, have you ever inhaled other people’s cigarette smoke indoors at home?’. Those classified as PS in indoors of public places (PPS) were those who answered ‘yes’ to the question: ‘Did you ever inhale other people’s cigarette smoke indoors in public places (excluding designated smoking areas) in the past seven days?’. Public places included public institutions, schools, libraries, transportation, performance halls, tourist accommodations, game providers, and restaurants. Moreover, those who answered ‘yes’ to any of the above three questions (home, workplaces, public places) were defined as the total passive smoking (TPS) group. We considered exposure to PS when UC was higher than the limit of detection (LOD)20,22. Therefore in our study, not being exposed to PS was defined for a UC concentration below the LOD. In KNHANES, the LOD was 0.27399 ng/mL until 2018 and 0.5 ng/mL from 2019. Our study defined exposure to PS when LOD ≥0.5 ng/mL, for historical consistency.
Statistical analysis
We conducted a descriptive analysis of the exposure rate by UC and the exposure rate of TPS, HPS, WPS, and PPS by self-report. Using UC as a reference, sensitivity, specificity, PPV, NPV, and Kappa of TPS, HPS, WPS, and PPS were analyzed and visualized through radar charts. Subgroups were analyzed concerning sex and age, and all analyses reflected the weight of complex sampling.
RESULTS
Passive smoking exposure in non-smokers by UC and SR
The PS exposure rate by UC was 44.4%, HPS was 5.1%, WPS was 18.0%, PPS was 22.4%, and TPS (HPS or WPS or PPS) was 29.5%. The exposure rate by UC was higher in men (48.4%) than in women (41.87%), and the exposure rate by SR in WPS and PPS was higher in men than in women, but in HPS, the exposure rate was higher in women (6.8%) than in men (2.4%). The exposure rate by UC was the highest among participants aged 45–64 years (46.4%), while for SR it was much lower (Table 1). Those aged ≥65 years reported the lowest exposure rate in all of TPS, HPS, WPS, and PPS (Table 1).
Table 1
Passive smoking exposure in non-smokers by urine cotinine and self-reports: subgroup analysis by sex and age group (2014-2020 Korea National Health and Nutrition Examination Survey data) Unit: Weighted % (standard error)
| Categories | Urine cotinine (UC)a (N=29622) (M=10326, F=19296) | Exposure indoor home or workplaces or public places (TPS) (N=29622) (M=10326, F=19296) | Indoor home (HPS) (N=29620) (M=10325, F=19295) | Indoor workplaces (WPS) (N=17000) (M=7097, F=9903) | Indoor public places (PPS) (N=29617) (M=10322, F=19295) |
|---|---|---|---|---|---|
| Overall | 44.4 (0.5) | 29.5 (0.4) | 5.1 (0.2) | 18.0 (0.4) | 22.4 (0.4) |
| Gender | |||||
| Male | 48.4 (0.7) | 34.8 (0.6) | 2.4 (0.2) | 23.7 (0.7) | 26.7 (0.6) |
| Female | 41.7 (0.6) | 25.9 (0.5) | 6.8 (0.2) | 12.7 (0.4) | 19.5 (0.4) |
| Categoriesb | UC (9673, 11286, 8663) | TPS (9673, 11286, 8663) | HPS (9673, 11285, 8662) | WPS (6292, 7790, 2918) | PPS (9672, 11286, 8659) |
| Age (years) | |||||
| 19–44 | 44.6 (0.8) | 34.5 (0.7) | 5.5 (0.3) | 17.6 (0.6) | 28.0 (0.6) |
| 45–64 | 46.4 (0.7) | 31.2(0.6) | 5.6 (0.3) | 20.2 (0.6) | 22.1 (0.5) |
| ≥65 | 39.9 (0.8) | 15.3 (0.5) | 3.3 (0.2) | 9.8 (0.6) | 10.9 (0.4) |
Sensitivity, specificity, PPV, NPV, and Kappa, of SRs based on UC
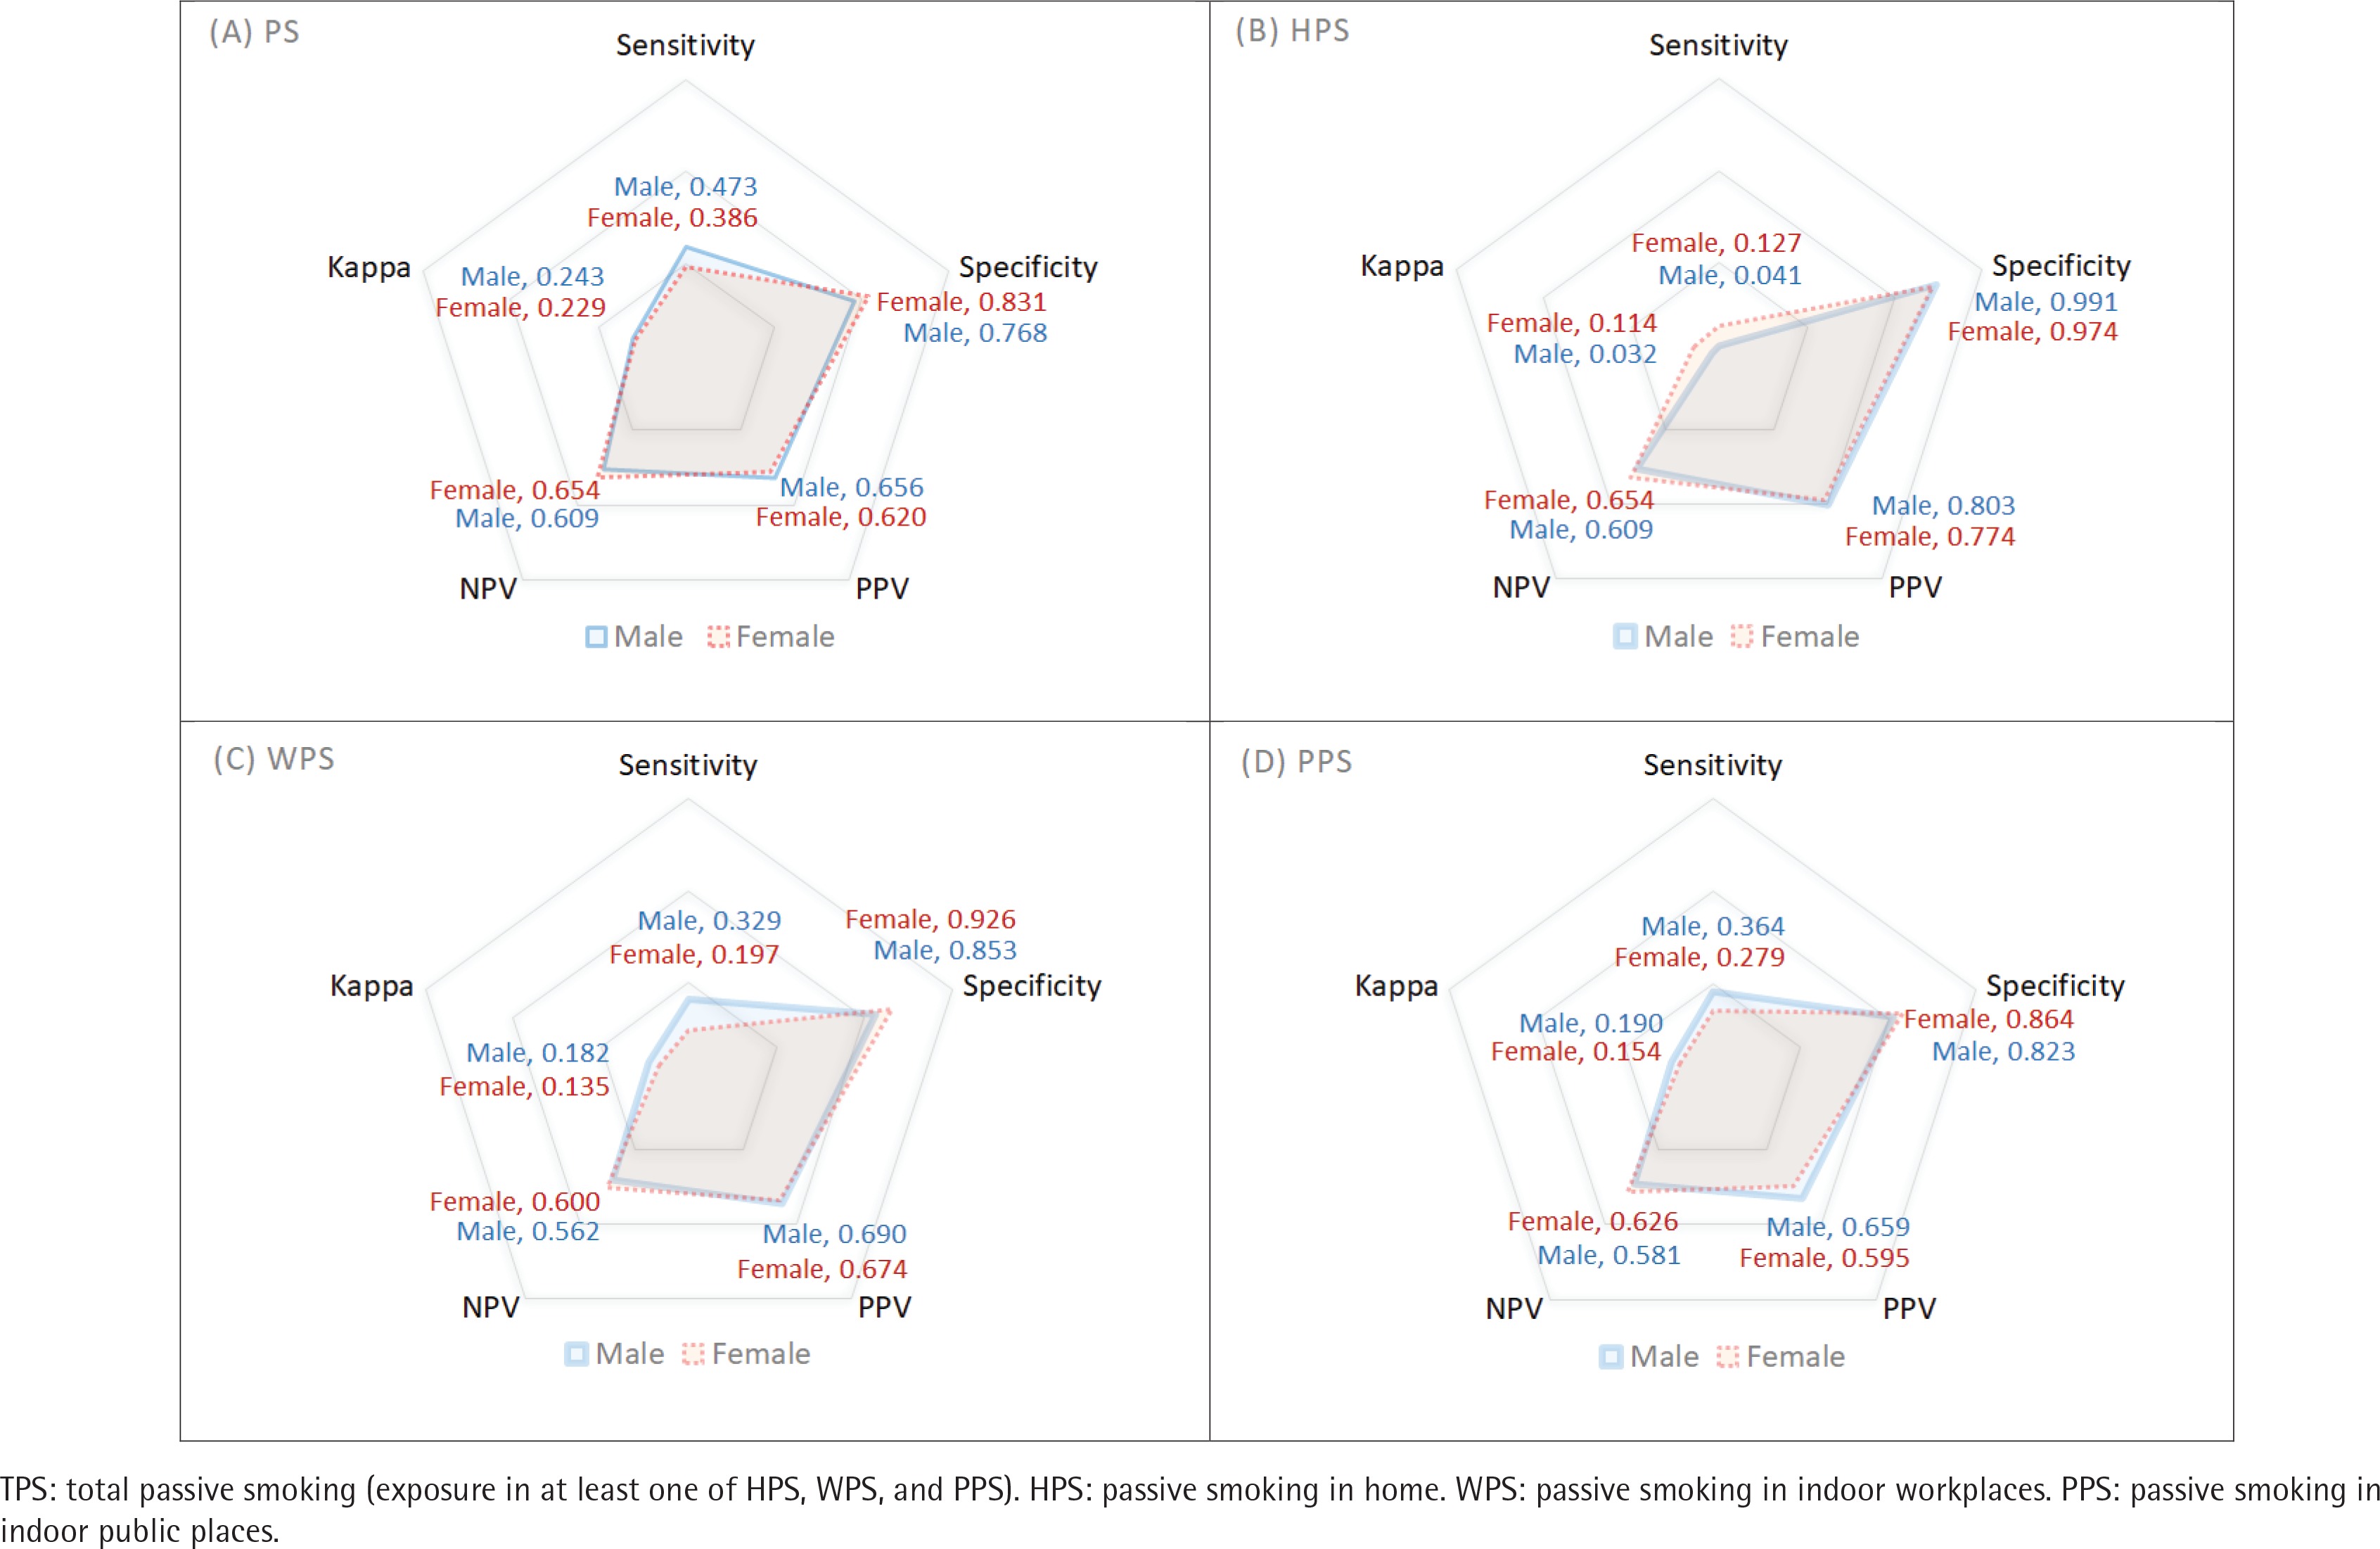
The accuracy of each parameter was evaluated with respect to sex. In the case of TPS, sensitivity and PPV were higher in men, but specificity and NPV were higher in women. Kappa was higher in men (0.243) than women (0.229). In the case of HPS, specificity and PPV were higher in men, but sensitivity and NPV were higher in women, and Kappa was higher in women (0.114) than in men (0.032). In the case of WPS, sensitivity and PPV were higher in men, but specificity and NPV were higher in women, and Kappa was higher in men (0.182) than in women (0.135). In the case of PPS, sensitivity and PPV were higher in men, but specificity and NPV were higher in women, and Kappa was higher in men (0.190) than in women (0.154) (Table 2).
Table 2
Summarizing the results of the accuracy for smoking rates according to urine cotinine and selfreports, by sex (2014-2020 Korea National Health and Nutrition Examination Survey data)
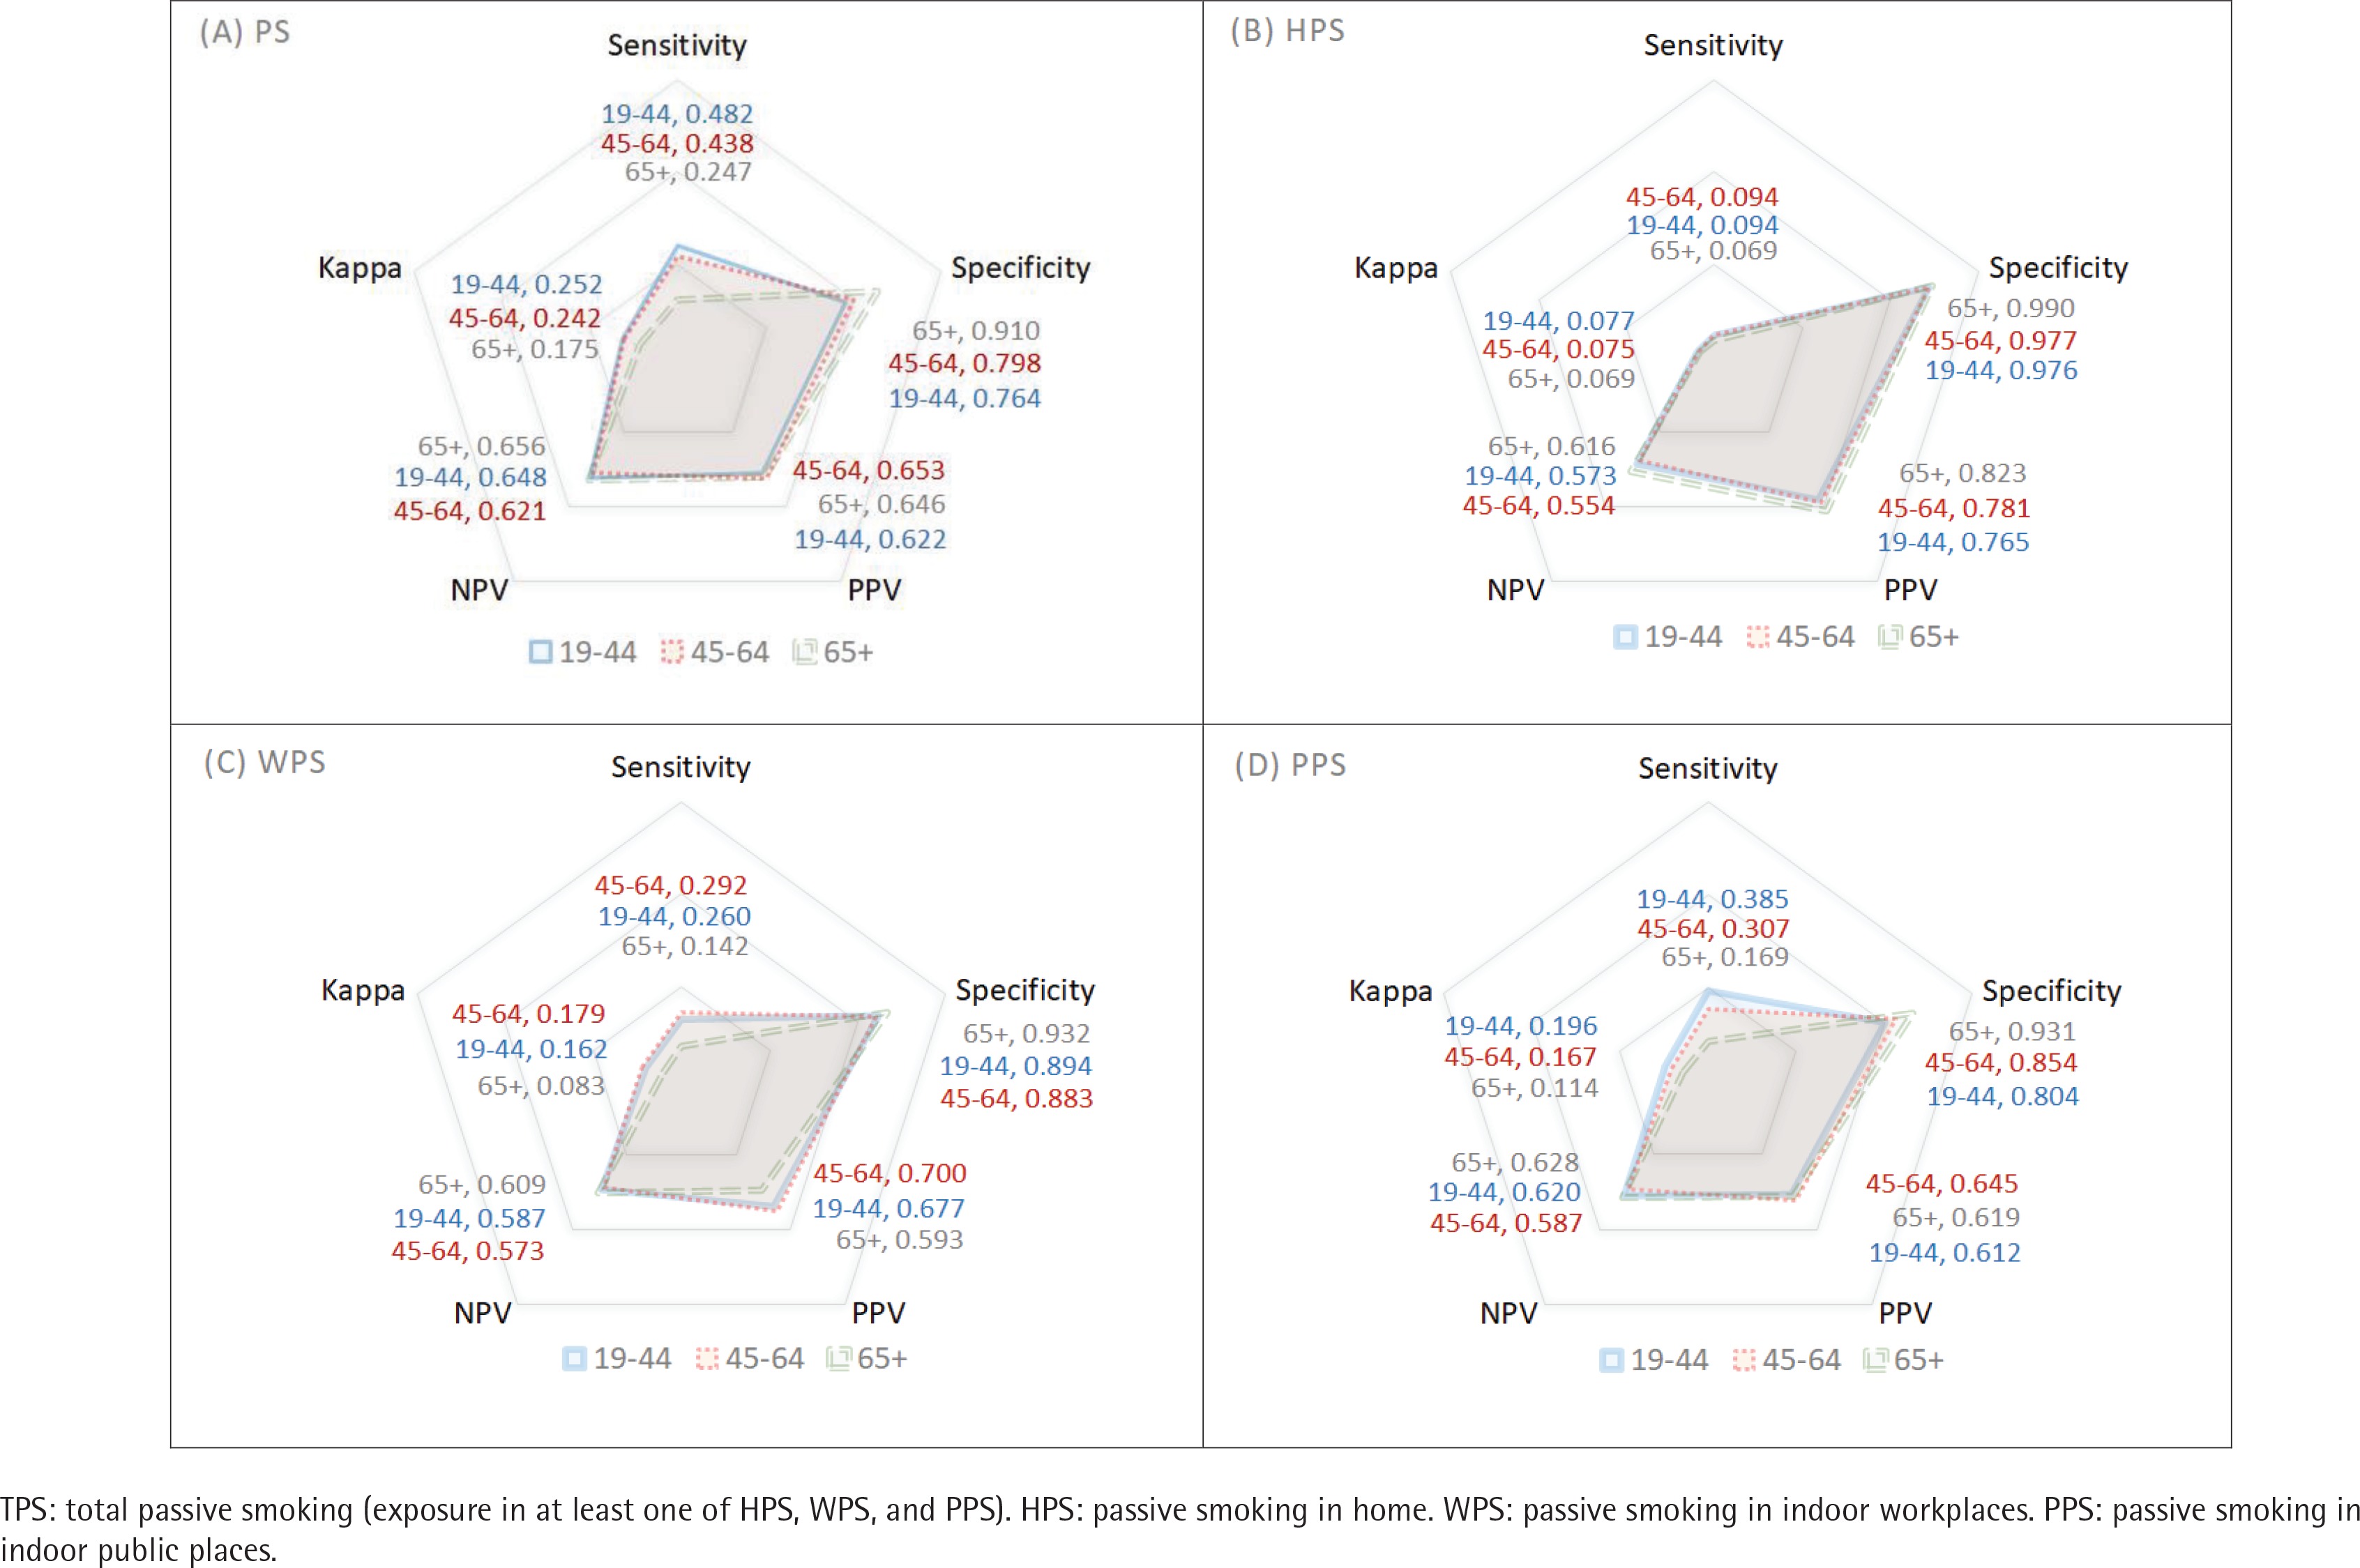
In addition, the accuracy of each parameter was checked with respect to the age group. For PS, the Kappa was highest among those aged 19–44 years (0.252), followed by those aged 45–64 years (0.242) and ≥65 years (0.175). In HPS, it was highest among those aged 19–44 years (0.077), followed by those aged 45–64 years (0.075) and ≥65 years (0.069). WPS was highest among those aged 45–64 years (0.179), followed by those aged 19–44 years (0.162) and ≥65 years (0.083). For PPS, it was highest among those aged 19–44 (0.196), followed by those aged 45–64 years (0.167) and ≥65 years (0.114) (Table 3).
Table 3
Summarizing results of the accuracy for smoking rates according to urine cotinine and self-reports, by age (2014-2020 Korea National Health and Nutrition Examination Survey data)
Figure 2 shows the overall accuracy with respect to sex. Except for HPS, in TPS, WPS, and PPS, men had higher Kappa and sensitivity values than women. Figure 3 shows the accuracy according to age. Kappa and sensitivity values were lowest among those aged ≥65 years. In contrast, specificity and NPV were highest among those aged ≥65 years. Overall, sensitivity and PPV values were low, and specificity and NPV values had relatively higher accuracy. Moreover, the Kappa and sensitivity values of HPS were lower than those of TPS, WPS, and PPS.
DISCUSSION
Studies that have examined self-report and biomarkers for identifying smokers are many. However, studies on the validity of PS exposure rates using self-report and biomarkers are limited. In particular, studies using national-level data, not specific groups such as patients and pregnant women, are lacking.
Our findings indicated that the PS exposure rate using self-report was lower than that using a biomarker. These results are consistent with a study by Max et al.23 using NHANES of the US and with the study by Arheart et al.24 that reported that the PS exposure rate by self-report was underestimated. The overall Kappa indicating agreement between the measurement methods was low. In particular, the questions about exposure in the indoor home, workplaces, and public places were all <0.2, with a slight agreement. The TPS was also <2.5, confirming that the self-report did not adequately reflect the actual exposure rate to PS25.
On the other hand, in our study, the SR method had low sensitivity and relatively good specificity. Low sensitivity means that even though it was determined as exposure to PS using the urine cotinine (level above the limit of detection), it was classified as not exposed to PS using self-report. In other words, it means that the proportion of people who have been exposed to smoking but who answered that they had not been exposed to smoking is high. Relatively high specificity means that the rate of people classified as non-exposed by cotinine and not exposed to PS by self-report was high. For similar reasons, the negative PV values were higher than the sensitivity and PPV values.
These reasons can be inferred as follows. First, SR only reflects secondhand smoke. In other words, under the current response system, thirdhand smoke is not reflected because the question is whether or not they have recently inhaled other people’s cigarette smoke. Thirdhand smoke is when an individual is exposed to substances released to the air after being absorbed into the smoker’s body, clothes, walls, or curtains, even if they are not exposed to the cigarette smoke caused by others. Recent studies have reported increased urine cotinine due to thirdhand smoke, even when not exposed to secondhand smoke26-28. Second, self-report cannot measure exposure in all settings. In Korea NHANES, the interview was on exposure at home, work, and public places. However, exposure may occur in other areas, such as bars and sports facilities. Furthermore, NHANES in the US, including Korea, and population-based surveys mostly conduct interviews on indoor exposure17,29. Therefore, it is difficult for self-report to properly reflect exposure to smoking outdoors. Third, in the case of self-report, it may be a measurement error if the respondent does not remember when he/she was exposed over time or does not recognize it when exposed30.
Our findings indicate that SR might not reflect PS exposure fully. Furthermore, our study had very low agreement even though the limit of detection was not as stringent as 0.5 ng/mL due to the limitations of the laboratory analysis methods. If a value of 0.03 ng/mL, the limit of detection standard of urine cotinine in the US31, is used as the standard, the agreement and sensitivity will be much lower.
Because studies on the agreement between self-report and biomarkers at the population level are still lacking, more research is needed on whether the exposure rate due to self-report is underestimated or overestimated. However, it is more likely to be underestimated than overestimated. In addition, Kappa and sensitivity were significantly lower in indoor home exposure (HPS). This is because the biomarker is an indicator that shows exposure to smoking by secondhand and thirdhand smoke in all places. In other words, the lower the exposure rate by self-report compared to other settings, the lower the agreement with the biomarker. Since the home PS of men by self-report is one-third of that of women, the sensitivity of men is lower than that of women.
A low HPS assessed by the self-report does not necessarily mean less exposure to smoking in the home. Previous studies have revealed that SR does not reflect exposure at home fully17,32. Thirdhand smoke could happen in home without secondhand smoke, and homes are more vulnerable to long-term exposure to smoking materials, including thirdhand smoke, because people stay more at home than anywhere else33. For this reason, it has been reported that exposure at home was associated with higher levels of cotinine in the body of non-smokers than exposure at work or in public places17.
By age group, Kappa and sensitivity were lower among those aged ≥65 years than in other age groups. This is because the exposure rate by self-report was lower than that in other groups. In our study, exposure by self-report had very low Kappa and sensitivity overall and relatively higher specificity. Overall, self-reports are unlikely to label an exposed individual to PS as not being exposed. Furthermore, the lower the exposure rate by self-report, the higher the probability that actual exposure would be omitted. This study does not claim that exposure to PS should be measured using biomarkers just because self-report is inaccurate for measuring it. However, it should be considered that the evaluation by self-report does not fully reflect exposure to actual smoking. Since 2010, changes in exposure to PS by biomarkers or cotinine concentration have not decreased significantly compared to previous years17,34,35, which means that the cotinine concentration in the body of non-smokers is no longer decreasing at a certain level. In particular, the issue of low-concentration PS exposure is becoming a new challenge17. Even low levels of exposure can be harmful to humans, and since there is no safe level of exposure to smoking, the goal should be to reduce exposure as minimally as possible36. However, the self-report method is difficult to assess low-concentration exposure accurately. This is because many of the non-exposed groups by self-report had cotinine concentrations above the limit of detection even though they were low, indicating that there was smoking exposure. Therefore, exposure should not be assessed solely by self-report. Only a few countries continuously monitor PS exposure rates using biomarkers at the national level, except for the US and UK. In particular, although bio-monitoring is possible in Korea, it is not used as an indicator at the national level. Therefore, countries that investigate biomarkers such as cotinine through health surveys should establish a PS surveillance system that considers both self-report and biomarkers.
Limitations
This study has some limitations. First, the urine cotinine concentration is affected by exposure time and intensity, but we did not consider these factors. Second, since this study was conducted in one country, attention should be paid to generalization to other countries. The accuracy in different cultures and countries may differ by gender and age. Nevertheless, since the method by self-report cannot reflect all exposures, the possibility that self-report will have a lower exposure rate compared to biomarkers is very likely to be generalizable. Finally, in this study, only three places were exposed by self-report: indoor home, workplaces, and public places. In the case of NHANES in the US, more diverse questions such as restaurant, bar, car, another home, and other indoor areas are asked, and the more questions about the exposure place, the more accurate the comparison with the biomarker can be derived.
CONCLUSIONS
Despite exposure to PS using the self-report method, there is high probability that an individual is labeled as non-exposed. In our study, Kappa and sensitivity were relatively low compared to specificity. Biomonitoring (using biomarkers such as cotinine) and self-report should be conducted simultaneously to include thirdhand smoke, evaluate measurement error due to self-report, and measure exposure rate in all settings.